The 50-Day MA Setup
On this page we are looking at one kind of setup. The illustrations at the bottom half of the “Stock Alerts” page show the ideal configurations. They are “clean” patterns. Those are what you want to see before buying. This page is an effort to show what we mean by a “clean” pattern for one type of setup. The setup involves a rapidly rising 50-day moving average in which the stock has been above that average and then either declines to it or moves sideways until it encounters it again. After that, we must see a positive reaction to buying activity along that line.
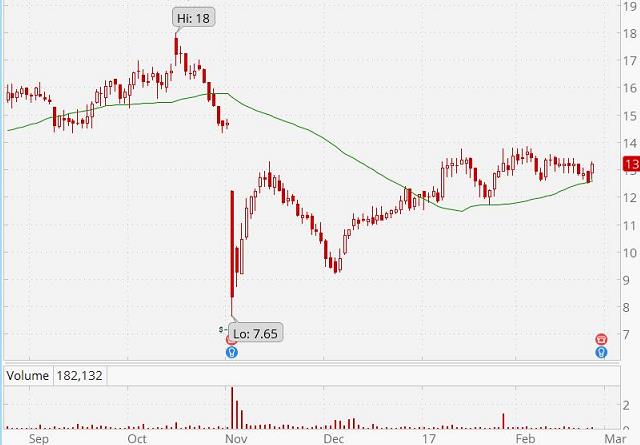
We would skip this one because the 50-day moving average is advancing too slowly. Also the gap down in November is scary and also adds overhead resistance.

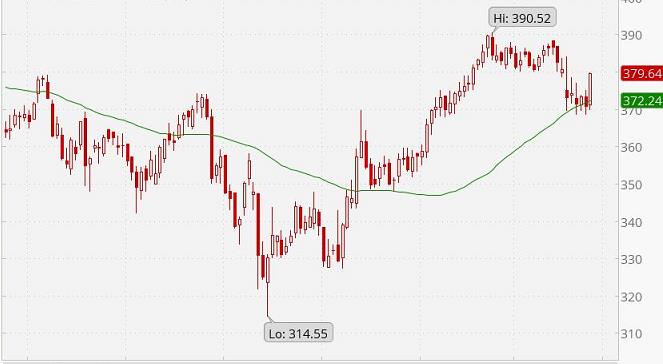
This is much better. Note how the 50-day average acted as overhead resistance before Novenber. That shows it is an effective indicator of buying/selling interests. Once the stock broke out above the line, the average converted to support. Though there was some penetration of the line afterwards, that penetration is minor and not enough to trigger a stop loss just below the line. We would not have bought this stock when it declined to the green line because we wait for a reaction to the support that we expect there. If we were to buy, it would be after the stock climbed back above the green line enough that nearly alll of the trading range is above the green line. We may even wait for the lows to be above that line.
We would be interested in this one because the reaction to the 50-day moving average was strong and immediate. When it acted as overhead resistance, it did allow some penetration. However, when the stock got above the line, it acted as support with no penetration the first time and only minor penetration the second time.
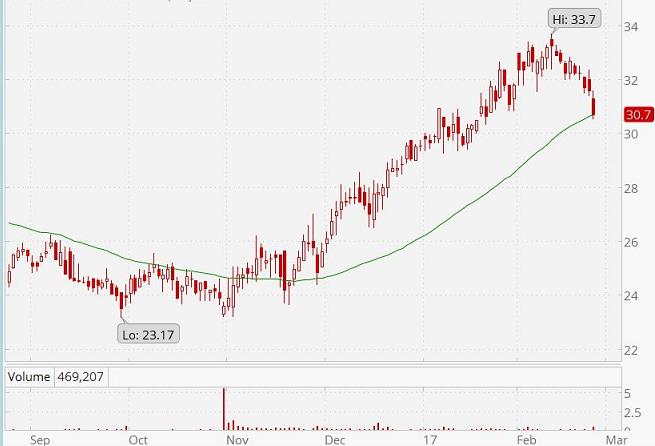
This is the kind of configuration that we like to see. Our main concern here is the last long black candlestick. However, this is the ideal pattern. Now we would wait for a reaction to the expected support. If we get a rebound off the green line and if there is a high that is greater than the high of the last candlestick shown above, we would be willing to buy if there is no overhead resistancee nearby. There is resistance at 33.70 (see the price bubble in the chart. However, other than that, the pattern shows nothing through September, and given the shape of the pattern and the fact that the green line was low and declining before that, it is likely that any resistance would be at least a year old. Therefore, we would check a 5-year chart to see if there is any overhead resistance that would concern us. As for the resistance at 33.70, we do not think it is a problem, given lthe strong positive slope of the green line. Even if the resistance becomes insurmountable, we should be able to get out with a small gain. Even a small loss would make this pattern worth the effort. If there is a volume surge on the rebound, it is highly unlikely that the resistance would stop this stock.
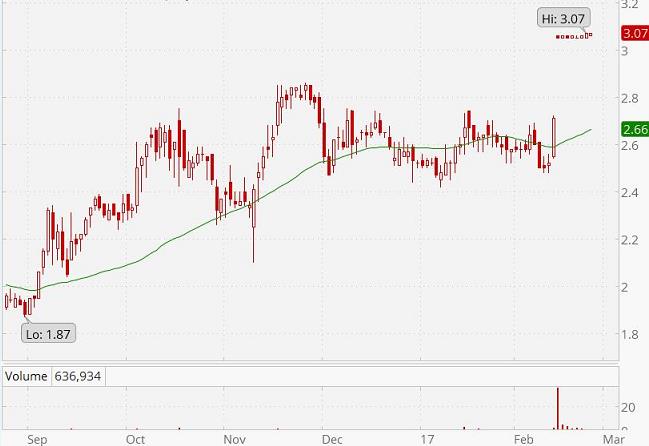
This pattern is terrible. Note the many times in which the stock ignored the green line. Note especially that after December, it crossed the line easily in both directions. If lthe stock were to get a little higher and then decline to the line, we would still consider it uninteresting. Also, the green line has an anemic angle of ascent. There is no robustness to it. Buying this stock, on the basis of the 50-day moving average setup we are discussing, would be a big disappointment. Actually, from another perspective, this stock might be acceptable, if the conditions were right. For example, note the strong uptrend of the green line before December. After December, the stock moved sideways. During that time the stock consolidated its previous gain. Now, if the stock can rise above the highest high shown in the chart, and do so on increasing volume, we might expect a continuation of the trend that existed before December. However, this is a different kind of setup. As you can see, the stock did jump above the previous high, but it gapped up suddenly in a single day and traded flat after that. The pattern is that of a takeover. Under such conditions, we we would prefer to abandon the stock because it is not likely to go higher unless a second bidder begins to compete with the first bidder. There are other ways a targeted company might manage to get a higher bid, but we are now in the realm of speculation. We prefer to invest where the probabilities of a favorable outcome are clearer.
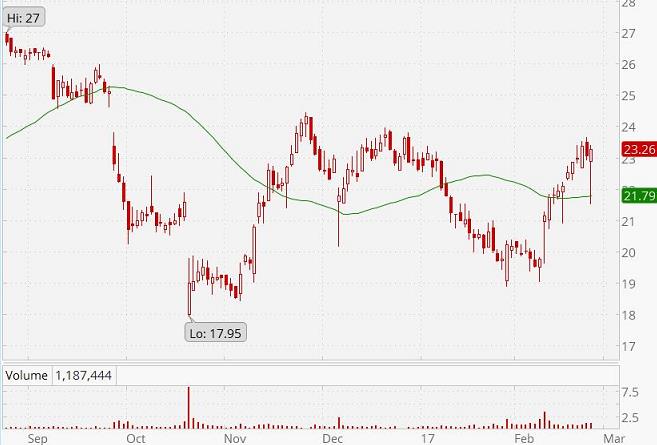
This is another terrible pattern. The 50-day moving average has not been very effective as support or resistance, especially after December. The green line is nearly flat, and that disqualifies it in terms of satisfying the conditions of this type of setup.