Published by Dr. Winton Felt
Dr. Winton Felt
Educational background.
Dr. Felt did his graduate level studies in Systems Engineering/Applied Mathematics, English, Management, and Clinical Psychology. During a good portion of the time he was involved in his graduate studies, Dr. Felt also operated his own business, teaching advanced reading and study techniques at four colleges in Southern California, and conducting special classes for various Christian organizations.
General history of securities-related experience.
Felt began his study of security trading patterns (emphasizing the “point-and-figure” method and outcome probabilities associated with various patterns) when he was in his early 20's. He became a professional in the financial services industry in 1985. He did his basic brokerage training at Merrill Lynch and achieved perfect scores on the “Series 7” in the areas of “Portfolio Analysis” and “Investment Strategies.” At Merrill Lynch he became the “Mutual Fund Coordinator.” A few years later, he was recruited by Bateman Eichler, Hill Richards (Everen Securities) to finish the development of a stock-trading system and to use it in managing a pooled account. He then founded Asset Management Systems and continued his work on the development, analysis, and evaluation of investment disciplines and strategies. He used multivariate analysis to test the profitability of more than 50,000 investment strategies. He then used the results of his analyses to design high total-return strategies. He also wrote algorithms to enable a computer to search through thousands of stocks to identify those that have any of a variety of behavior patterns known as "setups," price and volume configurations that most often occur shortly before a price surge. Dr. Felt created the Market Bias Indicator (MBI), also known as the Felt Oscillator, the Force of Trend (Group Pressure Gradient) indicator, and a procedure for discovering what he calls "Key Intraday Levels." He managed portfolios, created investment disciplines, created the publication originally known as Value Indicator (later renamed The Valuator), created what was originally a 70-page weekly publication known as StockAlerts (our present StockAlerts subscription service is a derivation and subset of this no longer available publication), and was the founder of Stock Disciplines, LLC.
Work and licenses before becoming the principal officer of Stock Disciplines, LLC.
Dr. Felt has held various licenses as an investment professional. During the years immediately before he became the principal officer of Felt Financial, LLC. (through which he managed investment advisory accounts), Dr. Felt held a “Series 7” General Securities license and was registered with the NASD. He also held a “Series 24” license issued by the NASD. A “Series 7” will qualify a person to be a “Registered Representative” or “Investment Broker,” and is the license held by the more qualified “brokers” at major brokerage houses. This license is a prerequisite to sitting for the “Series 24” exam. The “Series 24” license is required for those who supervise other brokers (securities regulations stipulate that every Broker/Dealer firm must have at least one individual who is licensed as a "General Securities Principal"). Having both a “Series 7” and a “Series 24,” Dr. Felt had the NASD designation “General Securities Principal” (it should be noted that registration and licensing by the State of California, the SEC, or the NASD does not represent a mark of approval or endorsement by these regulatory bodies, but that certain standards of knowledge and other requirements have been satisfied). During this time, Dr. Felt was affiliated with Titan Value Equities Group, Inc. as a Registered Representative, a Registered Principal, an Advisory Associate, and as the manager of an Office of Supervisory Jurisdiction. Felt Financial, LLC. (of which Dr. Felt was the principal officer), remained in the investment advisory business as a Registered Investment Advisor until December 31, 2005. After that date Felt Financial, LLC. became Stock Disciplines, LLC., and the firm (and Dr. Felt) stopped providing investment advisory services (use the link below for more on why the advisory business was abandoned). Dr. Felt has also conducted investment strategy seminars and tutorials for investors and brokers.
Past Affiliations.
Biola University in La Mirada, Asset Management Systems located in Costa Mesa and Newport Beach, and Felt Enterprises with primary locations in Oceanside and Carlsbad in California, USA.
Articles Published.
To see a few articles written by Dr. Felt, click on Articles.
If you know or have ever met Lawrence, Carolyn, Winton, Shirley, Wendy, Anthony, Larry, or Gail, we have a message for you. Read The Message
For more on Dr. Felt's strategy testing and why he stopped managing money for others, see item #10 after clicking on Leaving the advisory business.
Return to About Us for information about the company.
View
View all posts by Dr. Winton Felt

 Go directly to Gold and Silver
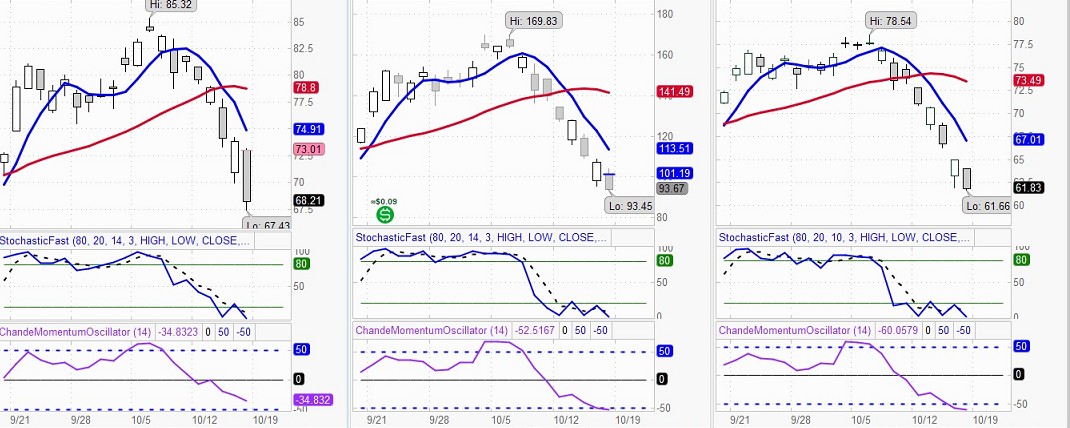
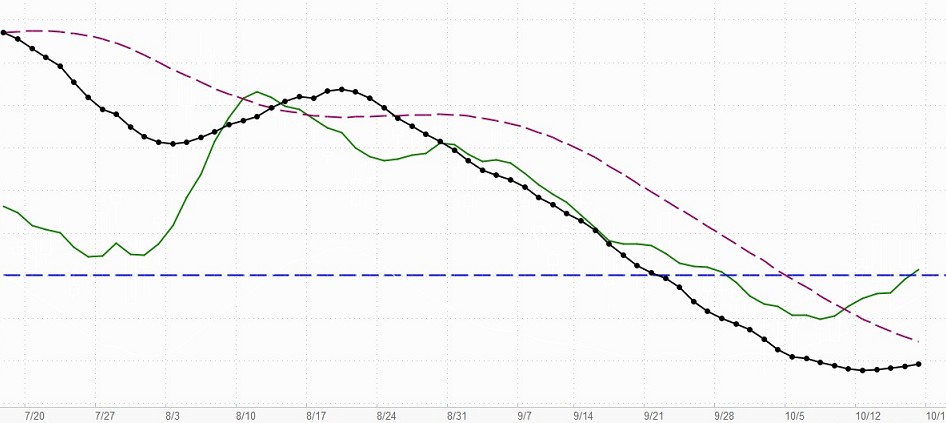
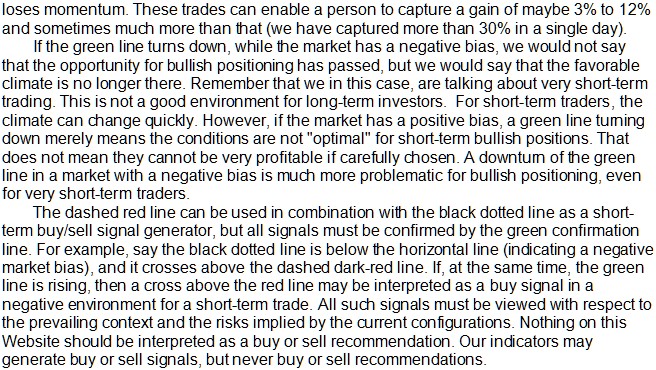
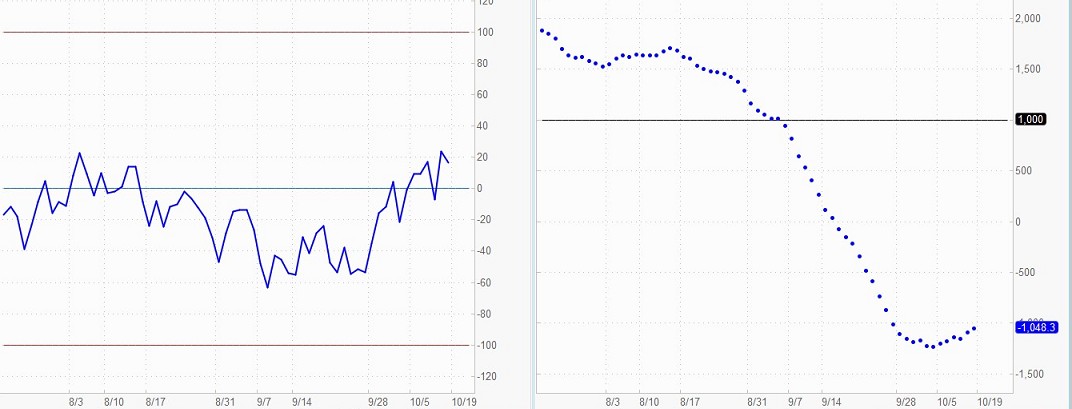
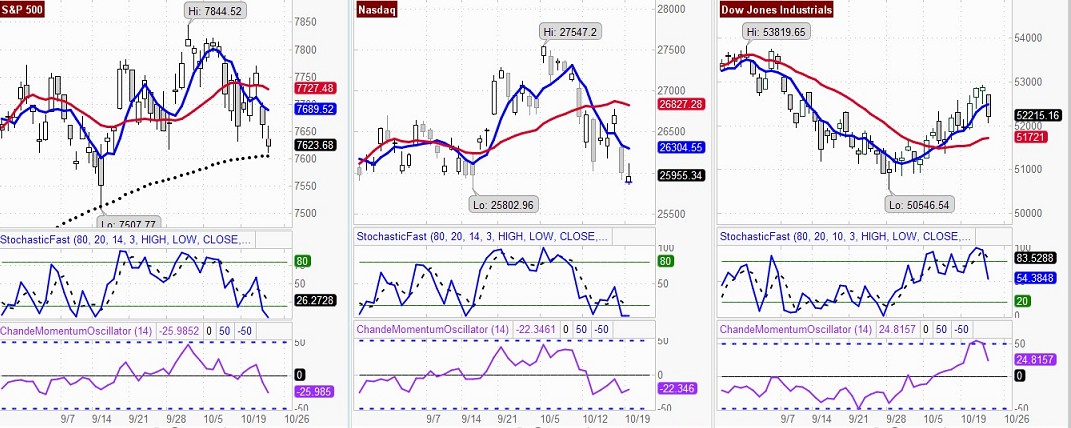 Explanations for Charts Above and Below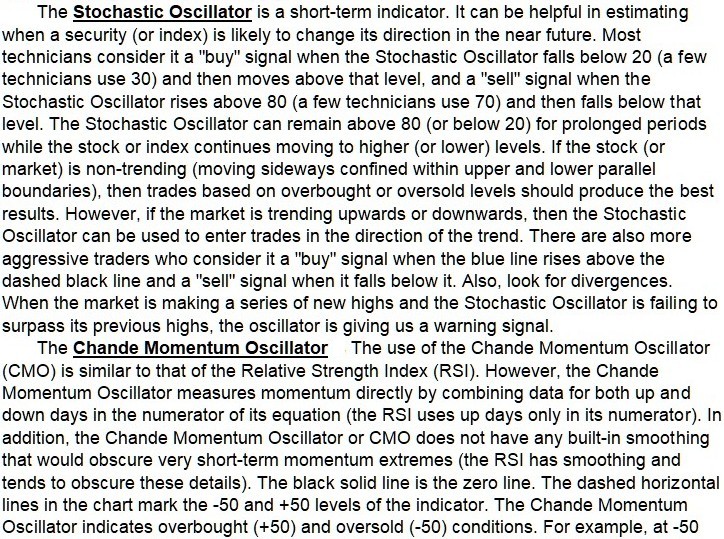
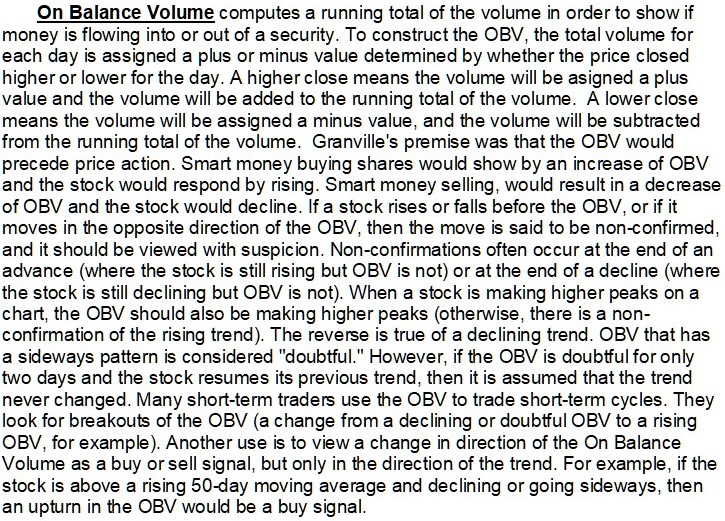
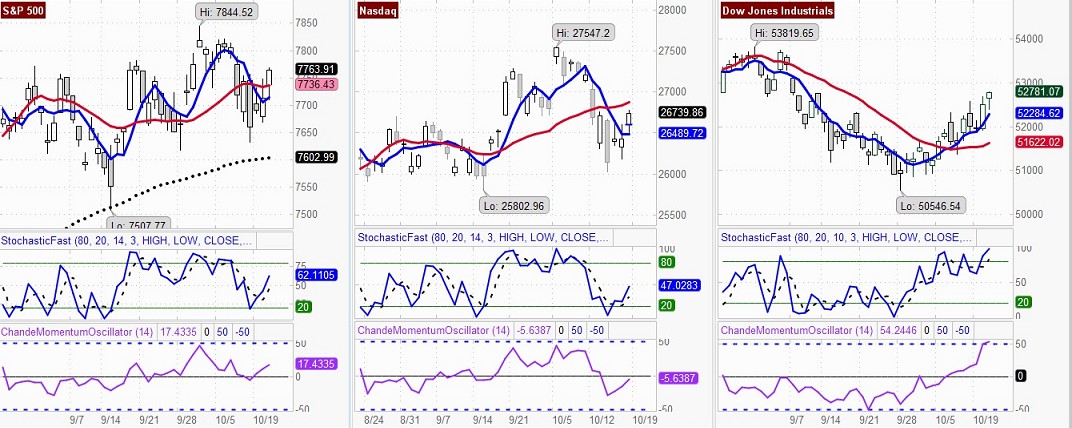
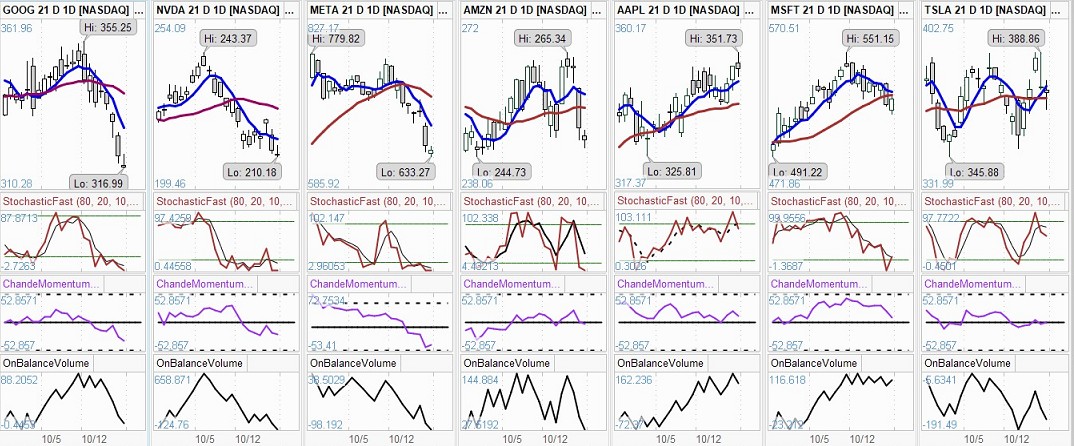 See above for Stochastic Oscillator, Chande Momentum Oscillator (CMO), On Balance Volume
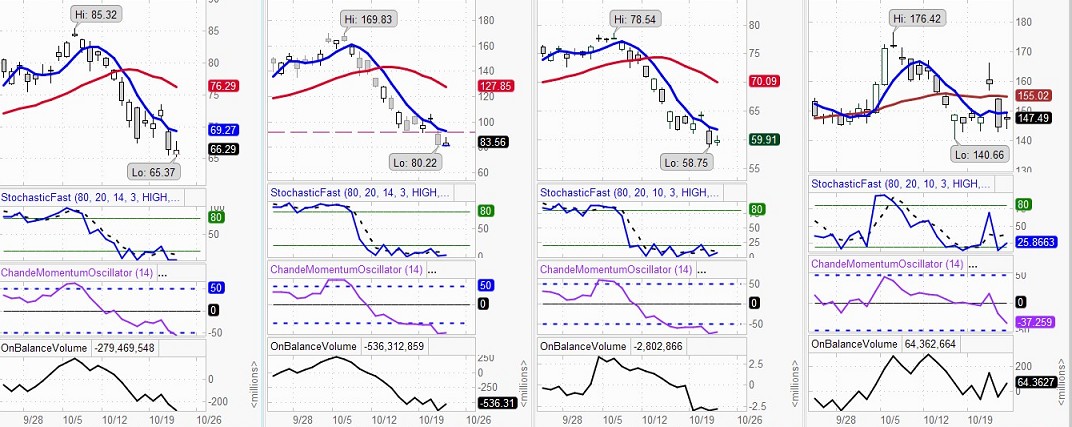 See above for Stochastic Oscillator, Chande Momentum Oscillator (CMO), On Balance Volume
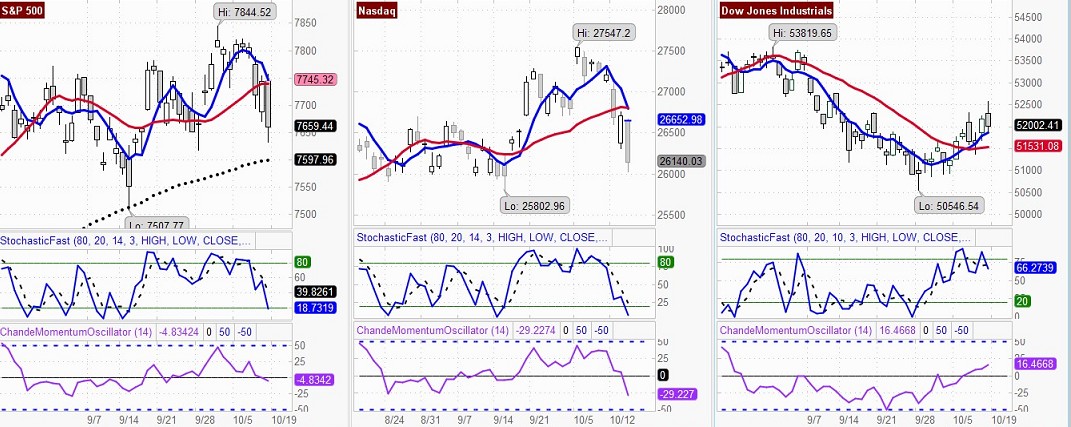 If the blue line is above red line, the last signal was a “Buy.” Otherwise, it was a “Sell”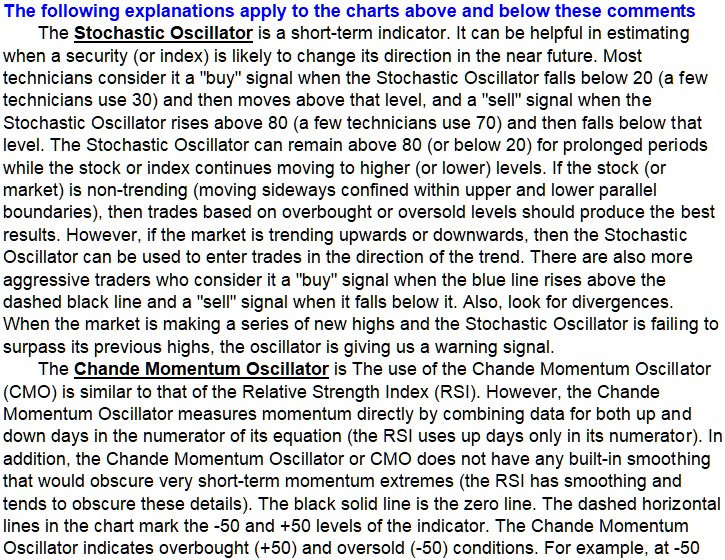

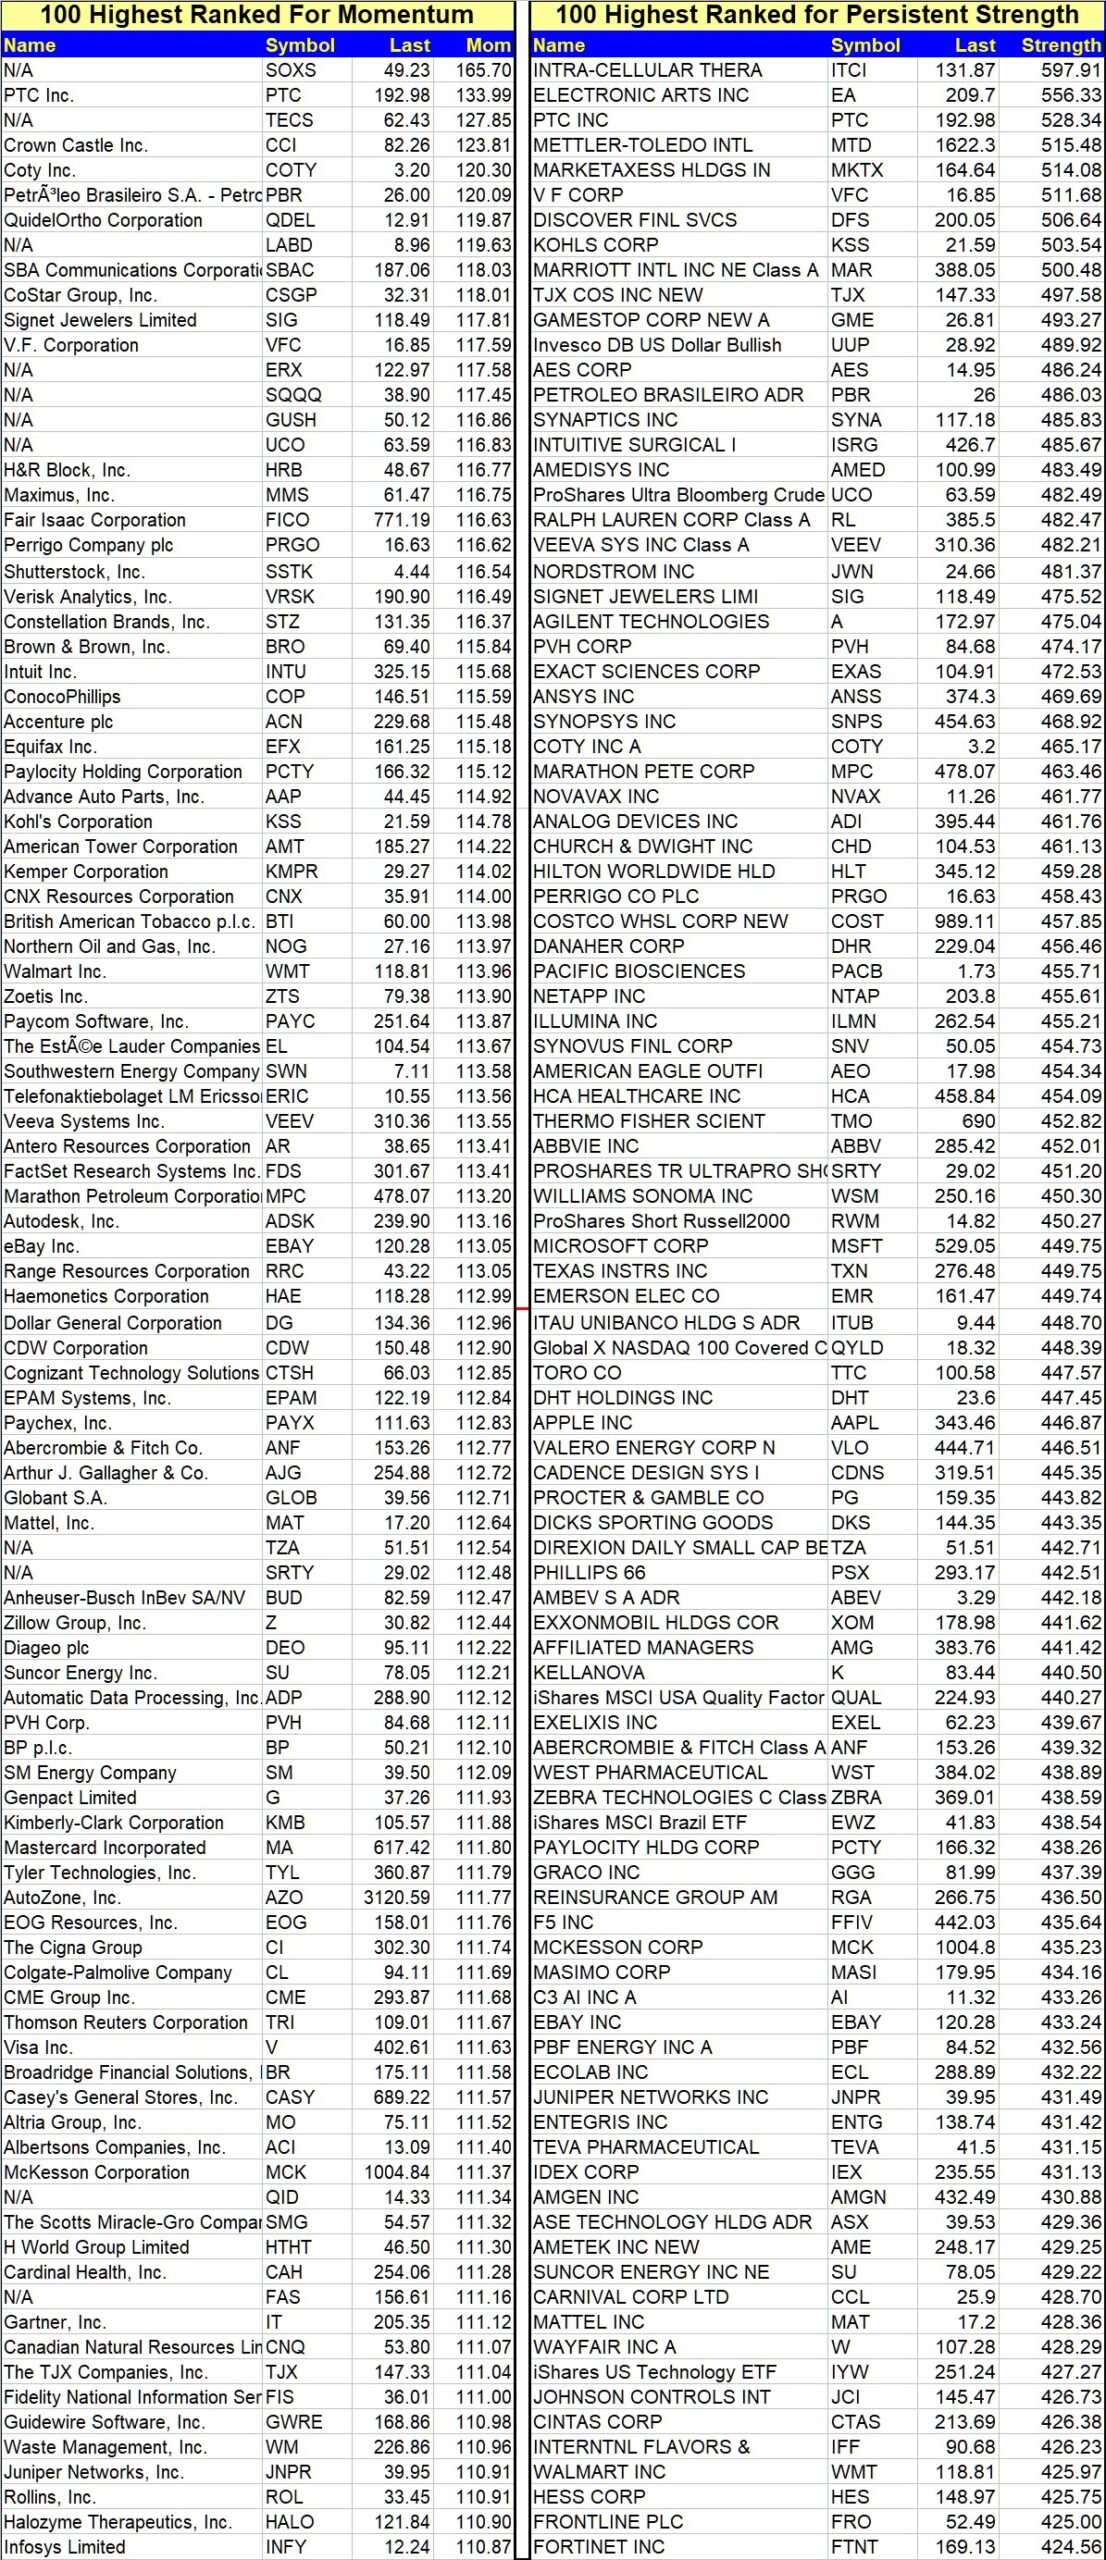
 Updated Daily
 Updated Daily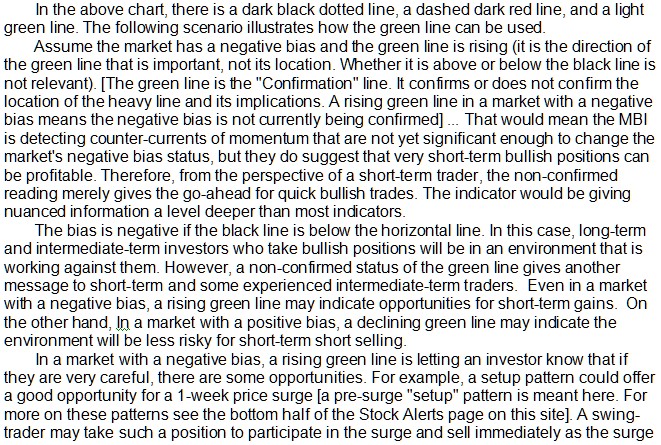

 See what this means