Nasdaq Composite With Donchian & SAR Systems 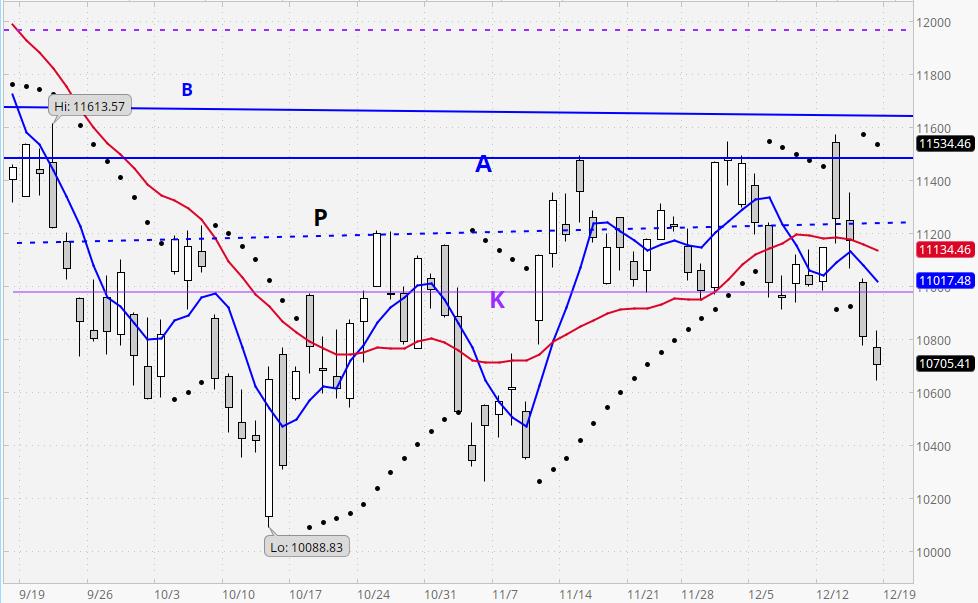
The above chart shows two trading systems applied to the Nadaq Composite Index. The Donchian (5×20) dual moving average crossover system tracks the 20-day moving average (red) and the 5-day moving average (blue). If the blue line crosses above the red line, the system is bullish. For many, this constitues a “buy” signal. If the blue line crosses below the red line, the system is bearish, and giving a sell signal.
The second system was created by Welles Wilder and is called the Parabolic SAR (Stop And Reverse) system. As prices trend up, the rising black dots below the price tend to accelerate upwards. The same thing occurs in a downtrend (except that the dots are above the price bars, and they accelerate downwards). When the price bar rises above the lowest of the declining black dots, a buy signal occurs. The system, designed for short-term traders, is very sensitive (it reacts to relatively small moves). A drawback of the system is that it tends to whipsaw during non-trending markets. However, it works well when the market is trending. The black dots are sometimes used for both buying and selling. Sometimes they are used only as reference points for placing stop losses. In the past, we have also used the system on the “Home” page as a short-term bullish/bearish indicator for the Nasdaq Composite Index.