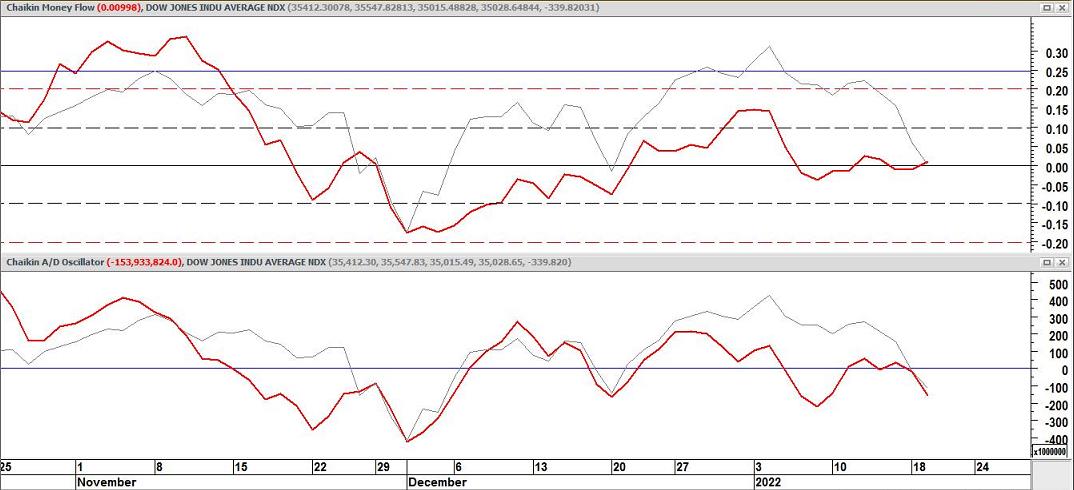
Chaikin Money Flow & Chaikin A/D Oscillator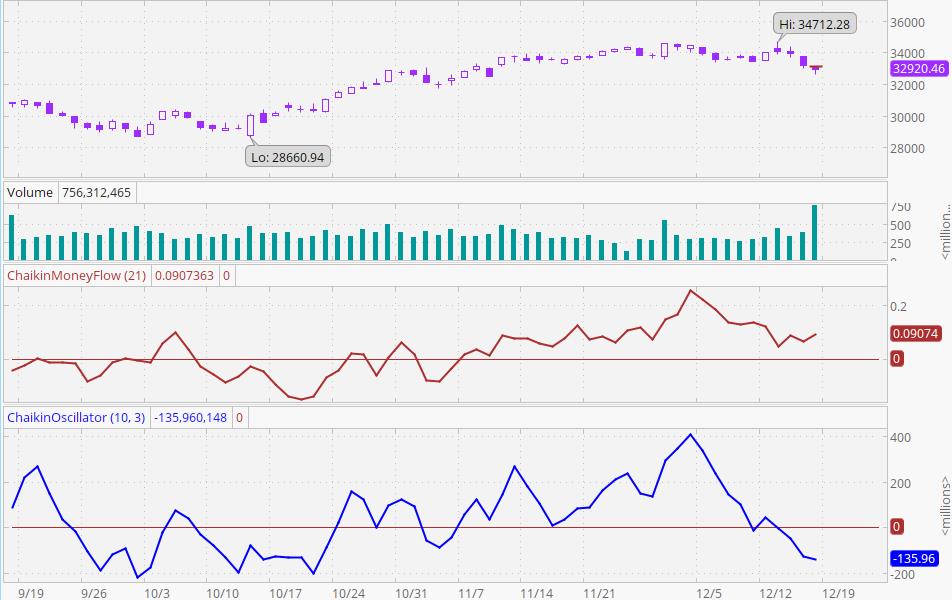
Here, we are focusing on the two bottom charts. Above them are the Dow and volume to give context to the bottom two charts. Regarding the two bottom charts, the top one is the Chaikin Money Flow indicator. The indicator line is heavy and red. This indicator attempts to measure money flowing in and out of a security (in this case, the Dow). The movement of money into or out of the market can give us clues about the meaning of price movement. Look for divergences between the Chaikin Money Flow indicator and price action. If the price moves higher and Chaikin’s Money Flow indicator moves lower, the rise in prices is not supported by an influx of money, and the rally is likely to be short-lived. If Chaikin’s Money Flow indicator is between zero and .10 (0 is marked by the solid horizontal line), then it is thought to be reflecting weak buying and is not particularly bullish. However, Chaikin Money Flow readings above .10 are bullish. If Chaikin’s Money Flow is between zero and -.10, then it is considered to be weak selling and it is not particularly bearish. Readings below -10 are normally considered bearish. Readings of .20 are bullish (-20 is bearish). Readings above .25 are very bullish and indicate higher prices are probably ahead. Readings below -.25 are very bearish and indicate that lower prices are probably ahead. Please note how the flow of money often precedes price action. However, money flow and price action will sometimes diverge. When that happens, do not trust that the current price action of the Dow will continue. When money persistently flows into the Dow, expect an advance.
The Chaikin Advance/Decline Oscillator is on the bottom. Here, the indicator line is heavy and blue. This indicator uses the same data that is used in the accumulation/distribution line. However, it is created by subtracting a 10-day exponential moving average of he accumulation/distribution line from the 3-day exponential moving average of the accumulation/distribution line. The premise for the Chaikin Advance/Decline Oscillator is that a healthy price advance is accompanied by strong volume accumulation (a rising Chaikin Oscillator). It is a positive indication if the Chaikin Oscillator declines while the Dow declines (volume is not supporting the decline). Because volume drives rallies, lagging volume during a rally is a sign of weakness (the rally is “low on fuel”). The Chaikin Oscillator was designed to indicate the flow of volume into and out of a stock (the Dow in this case). Comparison of this volume flow to the Dow’s action can help identify tops and bottoms. Look for divergences. When prices reach a new high or low, especially at an overbought or oversold level (see the CMO or the stochastic oscillator), and the Chaikin Oscillator fails to make a new high or low and then reverses direction, it is a warning that price direction is likely to change. Another use is to view a change in direction of the Chaikin Oscillator as a buy or sell signal, but only in the direction of the trend. For example, if the Dow is above a rising 50-day moving average, then an upturn in the Chaikin Oscillator while it is in negative territory would be a buy signal, especially when the Dow is very close to the 50-day moving average. A scale on the right is in millions and can be ignored because it is not necessary. The important thing is the movement (highs, lows, and direction) of the indicator (blue line) relative to that of the Dow (light gray line).