R.C. Allen Alerts
Stock signals: alerts of R.C. Allen’s Triple Moving Average Crossover strategy
At one time we published lists of stocks that generated buy or sell signals based on the R.C. Allen 4-9-18 Moving Average Crossover Discipline. Because we no longer charge for subscriptions, we have had to reduce the number of subscriptions we offer. However, there is good information here, so we have not removed this page. Also, this page will be a good reference In the event that we offer such reports again.
Alerts are alerts. They are not “buy” or “sell” signals. An alert means “analyze this.” When one of our screens flashes an alert, it means only that certain setup conditions have been satisfied. With regard to R.C. Allen alerts, It means that the 4-day moving average has crossed above both the 9-day moving average and the 18-day moving average and also that the 9-day moving average has crossed above the 18-day moving average. It may also mean that the 4-day moving average has crossed below both the 9-day moving average and the 18-day moving average and also that the 9-day moving average has crossed below the 18-day moving average. That does not mean that all setup conditions are satisfied for a purchase or short sale. For example, there may be overhead resistance that only the human eye can detect. Therefore, inasmuch as an alert means only that a single set of conditions has been satisfied, the logical response to an alert is to make a visual inspection of the stock’s chart. Look for reasons to avoid taking action. For example, if the alert is an “Up Alert,” look for reasons to avoid buying. One reason would be overhead resistance not far above the current price. For example, if the “Up Alert” occurs when the price is $45 a share, but the chart shows that the stock has declined on the 5 previous times when it reached $47, then you know there is overhead resistance at $47. The chances are high that it will stop rising at that level, and it may begin to decline there. Therefore, it might be wise to wait and see if the stock can rise above $47 and stay there a few days before buying. If you can find anything that makes you wary or uncomfortable, it would be rational to walk away.
The system featured here was made popular by R.C. Allen (How to Build A Fortune in Commodities) as an effective tool for trading both stocks and commodities. However, even R.C. Allen did not consider the signals generated by his system to be “buy” or “sell” signals without regard to their context. He simply argued that the commencement of a trend could be traded correctly by waiting for these averages to align themselves in a particular way. It may help to think of these averages as currents of momentum. When the “momentum currents” build to a certain level, an alert is generated. There is a specific alignment for the commencement of a downtrend and another specific alignment for the commencement of an uptrend. Of course there are considerations that must be considered other than these alignments.
The greater the surge in volume at the time an alert is generated, the more likely it is that the stock will follow through with a continuation of the move. Many traders who use the R.C. Allen system pay special attention to the direction of the 4-day moving average. They use the direction of the 4-day moving average as a kind of warning system. If there has been an “Up Alert,” those people may decide not to buy if the 4-day moving average is declining. A declining 4-day moving average may be a warning that the last signal may be a “whip-saw.” It indicates the beginning of a minor counter-trend to the trend that caused the signal. Such traders will wait for the 4-day moving average to be rising again (while the other moving averages are still aligned correctly) before buying.
The Alert System
1.) An “Up Alert” means that the 4-day MA is above the 9-day MA and the 9-day MA is above the 18-day MA. — If a stock is rising, its shorter moving averages will move up faster than its longer moving averages. Waiting for all moving averages to align correctly gives time for momentum to build, and it helps a potential buyer avoid some false starts. This is one of the ways the strategy incorporates discipline. The alert to a possible “buy” signal occurs when the 4-day moving average crosses above the 9-day moving average. The actual buy signal occurs when the 9-day moving average crosses above the 18-day moving average while the 4-day moving average is still above the 9-day moving average. If at the time the 9-day moving average crosses above the 18-day moving average, the 4-day moving average is below the 9-day moving average, there is no signal unless and until the 4-day moving average crosses back above the 9-day. Conversely, a “Down Alert” means that the 4-day moving average is below the 9-day moving average and the 9-day moving average has just crossed below the 18-day MA.
2.) Furthermore, an “Up Alert” means that the 9-day moving average was below the 18-day moving average on the previous day. — This implies the stock was recently declining and may be just beginning to rise. Here, the idea is to catch a stock at the beginning of a new trend. A “Down Alert” means that the 9-day moving average was above the 18-day moving average on the previous day. This implies the stock was recently rising and may be just beginning to decline.
3.) R.C. Allen said that “In a bull market, the volume of sales should increase as prices rise. If the volume does not increase, it may be a false move or ‘trap.’ Even though your charts may show a ‘breakout’ towards higher levels, the up move should never be trusted unless it occurs with an increase in the volume of the sales.” The same thing can be said of down moves. If volume declines on a down move, that move should not to be trusted. On 3/28/11 our system found 110 R.C. Allen alerts. Of those, 106 were “Up Alerts” and 4 were “Down Alerts.” On that day the market had declined and most of the alerts had a decrease in volume. According to Allen, such alerts are not to be trusted. When we filtered out the alerts with volume decreases we were left with 44 alerts of which 42 were “Up Alerts.” Under the heading “Vol %” we give the 1-day change in volume on the day the alert is registered.
4.) R.C. Allen only required the alignment of moving averages as described in item 1. What if you have an “Up Alert” in which the 4-day moving average is above the 9-day moving average but declining? This could be an indication that the signal may result in a whipsaw (a sell signal shortly after the buy signal). You can screen out such “setups” by using information in the column with the heading “4-Day MA.” That column indicates whether the 4-day average is rising or falling. Therefore, in addition to the proper alignment of moving averages, you may use the 4-day moving average to provide added confirmation of the signal by requiring that it also be moving in the direction of the crossover. Stocks are listed as giving an alert based on a strict compliance with Allen’s system. Under Allen’s rules, it is theoretically possible (though not common) for the 9-day moving average to be declining but still cross above the 18-day moving average. Also, the 9-day average could be rising when it crosses the 18-day average while the 18-day average is still declining (probably slowly). It will be up to you to inspect the charts and decide if those configurations are worthy of consideration on a case by case basis. R.C. Allen did not give rules for such situations, so our algorithm does not make those judgements for you either.
R.C. Allen’s system has been used successfully by thousands of traders over many years. If you cannot make it work for you, it is likely because you have not learned to implement it correctly. Richard Dennis, one of the world’s most accomplished traders, once trained a group of very intelligent people to be traders. He gave them all the same rules and trading system. A few made millions but some were failures. It all came down to implementation. Those who followed the rules did well. Those who second-guessed their system did poorly. Emotions will be your worst enemy when it comes to trading. Losses are a part of every discipline. If you think you have a good discipline but you lose money on 15 consecutive trades, an emotional trader might be more inclined to abandon his discipline or even abandon trading altogether. Successful traders do not. They may re-evaluate their system and the way they implement it, but if it is a good system that others have used successfully, they will not toss it away.
In our own studies, we programmed a computer to trade various strategies. One of the very best strategies generated many more losses than gains. The losses were all very small but many of the gains were large. Yet, the system was quite profitable. Most humans would not have been able to implement the strategy successfully because all the losses would have caused them to abandon it. However a computer does not get depressed when it has a losing trade. It keeps implementing a strategy no matter what happens. The key for a beginner is to strictly limit the amount that can be lost on each trade. If you are a beginner, use only a very small portion of your assets for trading and diversify the small portion that you trade.
Please Note
Some people consider these alignments, when complete, to be buy and sell signals rather than “alerts.” They act on them without question, and consider any false moves as merely the cost of doing business. Others prefer to think of them as “alerts.” For them, a buy or sell may be called for immediately, but sometimes they prefer a subsequent “trigger event.” A “trigger event” might be another price move in the crossover direction. However, after an alert is generated, it may take up to a week or more for a “trigger event” (buy or sell signal) to develop. If your strategy is to wait for a subsequent trigger event and two weeks go by without one, we would suggest that it is time to “walk away” from that situation. When our own traders are waiting for a trigger event, they consider the setup to have failed if the trigger event does not materialize within two weeks.
One System Among Several SystemsThe “character” of market behavior is in a state of flux. There will be times when none of the “setup” alerts reported by a particular alert system are attractive. In fact, an individual alert system can perform poorly for months at a time. That’s why we personally use a variety of alert systems. When one system isn’t working, another may be generating alerts after which the stocks follow through with spectacular surges in price. Our hope is that you will eventually come to see the advantage of having an arsenal of “idea-generators” that can keep you well supplied with good ideas most of the time. When it’s working well, R.C. Allen’s system can give earlier entries and exits than the 5x10x20 system. At other times, the somewhat slower approach of the 5x10x20 system may yield better results. We think the best results can be obtained by using a variety of alert systems as part of a disciplined approach to finding stocks for your watch list. When one system is not working well, there is often another that is. Monitoring a variety of systems and the way their setups evolve is how a person can discover which system to place the most emphasis on at a given time.
Want to know about the timeliness of these alerts? Click on New or Old?
An Illustration
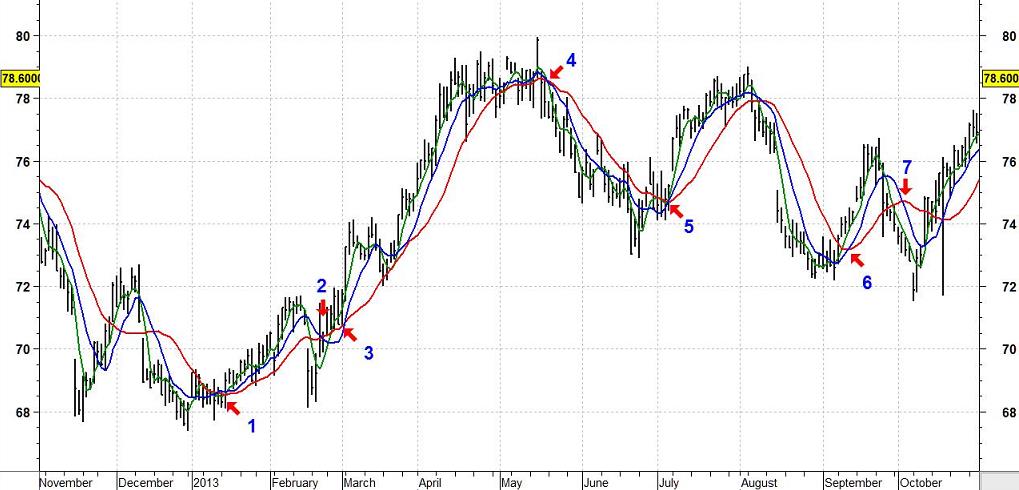
The above chart is of Wall Mart Stores (symnbol WMT). During this period, the stock generally moved sideways. The closing price at the beginning of the chart was 73.76 (11/6/2012) and the last closing price was 77.07 (11/1/2013). That would not represent much of a gain for a 1-year holding period.
You can design variations of RC Allen’s system. For example, in using the RC Allen system, if a person requires all moving averages to be moving in the direction that confirms the signal, the crossovers at #1 and #5 would be ignored because the red line (18-day moving average) is still declining at the time of the signal. You may not consider the crossover day to be a time to be buying, but you might wait until the 18-day moving average started to move up. Now here is another nuance that makes a difference in the buy/sell decision. You might want to use the 4-day moving average (light green in the chart) as a confirmation indicator to cut down on whipsaws. For example, if a buy signal is generated and the 4-day average is declining, you may not want to buy until the 4-day moving average is rising along with the other two moving averages. The declining 4-day moving average may be the first sign of a counter-move that will ultimately result in another sell signal. For example, the sell signal #2 (down arrow) just before #3 took place took place when the green 4-day average line moved higher, not lower. If you were trading this stock, you might not sell on this signal because a new buy signal might be in the making. Here, you would have been correct to ignore the sell signal. However, the sell signal at “4” could be acted on because all moving averages are declining. As you can see, the buy signal at #6 would have resulted in a small loss. There are many ways in which you can customize Allen’s system, or you can simply use it as Allen used it.
A Reason Not to Buy
The lists you will find here are not personal buy or sell recommendations. They are merely reports of stock activity and technical signals generated by a discipline. However, this system is well-known and widely followed. Proper alignment is not in itself a sufficient reason to buy or sell a stock. Any system can give a buy signal and still be wrong if there is strong overhead resistance just above current price levels. For example, in a moving average system, A stock can have the correct alignment of moving averages for a purchase but the pattern itself may still not be “ready’ or it may even be lousy (or dangerous).
Therefore, never depend on the signals of a system in isolation. Conduct further evaluation and analysis to determine if a stock should be bought or included on a short “Watch List.”
In general, we watch for a setup, the absence of significant overhead resistance, and a “trigger event.”
If there is overhead resistance immediately above the current price, there is reason to be apprehensive That resistance is a reason not to buy] If there is no resistance there, a good trigger event might be a follow-through price surge on increasing volume. If the resistance is there, we might still consider it to be a “setup” but modify the trigger event. For example, we might consider an acceptable trigger event to be a follow-through price surge on increasing volume that takes the stock through that resistance. Some experienced traders may even wait for a subsequent test of support at the previous level of resistance and then a resumption of the up-trend.
Instead of using Allen’s system to define the setup, some use it to define the trigger event. For example, the trader might look for good setups (a Bollinger squeeze with penetration of upper band, for example). These setups would have a context that is attractive. Then, they would wait for R.C. Allen’s discipline to give the final go-ahead.
At one time, we published separate lists of stocks that were about to generate or had generated an R.C. Allen alert. We no longer do that. However, you can create your own lists by plotting the three moving averages on a chart and then entering different symbols to see which are of interest. We suggest that you look at stocks highly ranked in the “Strength Rank %” column of The Valuator. If you look only at those with a rank of 75%, you will be looking at approximately 250 stocks that have greater strength than 75% of the most important stocks traded on the market. Among those stocks, look for the R.C. Allen setup. Using this approach, you will have relatively persistent momentum driving the stocks viewed. Any setups you find, will have that additional strength/momentum supporting them, increasing the probability that the setup will be profitable.
Notice We do NOT recommend that any individual use this trading system for a real account. We also do not recommend AGAINST using this system. That is a matter to be decided on by you personally.
How to create A Shortcut To Our Website Just to the left of our URL in your browser is a small image or padlock. Click on that image and drag it to your desktop. See FAQs if you need additional help.