Stochastics, Chaikin A/D and CMO
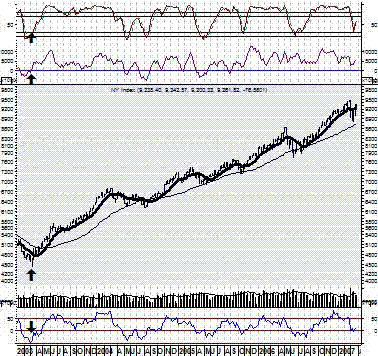
The chart below is intended to illustrate the use of the Stochastic Oscillator, the Chaikin Advance/Decline Oscillator, and the Chande Momentum Oscillator. These indicators are included on the “Home” page where they are current and updated daily. We wanted to preserve this chart to illustrate how powerful these signals can be when they converge. The explanations are a bit more detailed on the “Home” page than you will find at most other Web sites, but read the rest of this first.
Stochastic Oscillator
The Stochastic Oscillator indicates where a security’s closing price is relative to its trading range over the last x-time periods. There are several ways to interpret the oscillator. First, buy when the oscillator falls below 20 and then moves above that level, and sell when it rises above 80 and then falls below that level. However, it is important to determine if the security (or market index) is trending by using an indicator like a moving average (note whether the average is rising, falling, or moving sideways). If the market is non-trending, then trades based on overbought/oversold levels should produce the best results. If the market is trending, hen the oscillator can be used to enter trades in the direction of the trend. Second, Note when the %K line (see the solid line in our chart on the Home page) crosses above or below the %D line (see the dashed line in our chart on the Home page). A crossover above the %D line in oversold territory can signal a potential buying opportunity, while a crossover below the %D line in overbought territory might indicate a selling point. Third, look for divergences. When the security (or market index) is making a series of new highs and the Stochastic Oscillator is failing to surpass its previous highs, we have a warning signal. A bullish divergence occurs when the price records a lower low, but the oscillator forms a higher low, suggesting weakening downward momentum.
The oscillator is a very short-term indicator that tends to be most helpful when trying to determine the probable direction of a security or index in the days immediately ahead.
Weekly Chart of the General Market (The NYSE Index)
Notice that the arrow below the NYSE Index marks a new relative low. However the low marked on the Chaikin Advance/Decline Oscillator (second from top) is not as low as its previous low (a divergence indicating a probable rise in the market). The same point on the CMO (bopttom of chart) shows a higher low than in July (a divergence). An extreme reading of ±50 would also suggest a short-term peak (high or low) in the market. The Stochastic Oscillator at the top of the chart shows a bullish crossover. Together, these indicators suggest that though the market has been in decline (see the 50-day moving average in the vicinity of the arrow) a positive move of unknown duration and magnitude may be just ahead. The market subsequently began a significant up-trend. We have applied these indicators to the NYSE Index in this “tutorial,” but it should be obvious that the same observations and interpretations would apply to the analysis of individual stocks. In using these indicators on the NYSE Index, we hope to illustrate how we use them in support of our own disciplines. We use them to interpret and analyze the market in general. That analysis serves as the “environment” within which we apply our disciplines and strategies to individual stocks. Our discipline incorporates both levels. The conditions that prevail at the market level modify our strategies for buying and selling and also our sub-disciplines and tactics at the stock level. ~ Dr. Felt

