Breakouts
Breakouts, Price Reversals, and Stock Surge Patterns
In our own trading we have scanned thousands of stocks to find breakouts, price reversals, and stocks that are surging in price. These patterns are very attractive to traders. Stocks that have just had a breakout have overcome overhead resistance. Investor interest in them is very high. There are enough new “believers” in the stock to more than buy up all the shares being sold by those wanting to get out at the area of “resistance.” For that reason, breakouts attract attention and even more buyers. Prices often accelerate or surge on a breakout.
We scan for price reversals because they also attract attention. We are most interested in stocks that are starting to surge after their short-term moving average has changed from trending downward to trending upward. When a stock has been in a prolonged downtrend, a great deal of pessimism has been factored into the stock’s price. However, changing the stock’s direction is like changing the direction of an ocean liner. Therefore, when a price reversal occurs, traders are interested. Why? Because the reversal means there has been enough new buying interest to absorb and reverse all that negative momentum. By definition, a price reversal occurs at the early stage of a new trend. Most people want to buy at the beginning of a new trend, especially if the price begins to surge.
Price surges are located by The Valuator because stocks that are surging in price also draw new attention, and strength increases, the RSI rises, The CCI notices it, and the 10-day momentum scanner notes it. A price surge results when there is a sudden influx of new buy orders. New buying interest may be the result of higher earnings expectations, a new product, a favorable FDA ruling, a new cure or discovery, or some other exciting news. The price surge is the mark of new investor enthusiasm for the prospects of a company. Traders love to buy a stock that has just had a price or momentum surge because a surging stock enables them to obtain a greater return in less time with less risk.
The price reversals do not require that a stock be in a trading range with upper and lower boundaries just before it is detected, though that may be the case. In those cases, the stocks have repeatedly been turned back by resistance at the upper boundary of the trading range. Because they are the subject of considerable investor interest, they do not decline far when they are turned back by that resistance. In other words, they are in a relatively narrow trading range (chart illustrations are at the bottom of this page). Eventually, buying interest builds until the stock is able to break through that overhead resistance. The Valuator is sensitive to all of the above (reversals, surges, and breakouts). Therefore, some stocks may be listed because they have broken out of a trading range, some may have just had a non-trading range “breakout,” and others may be highly ranked for reasons other than a breakout.
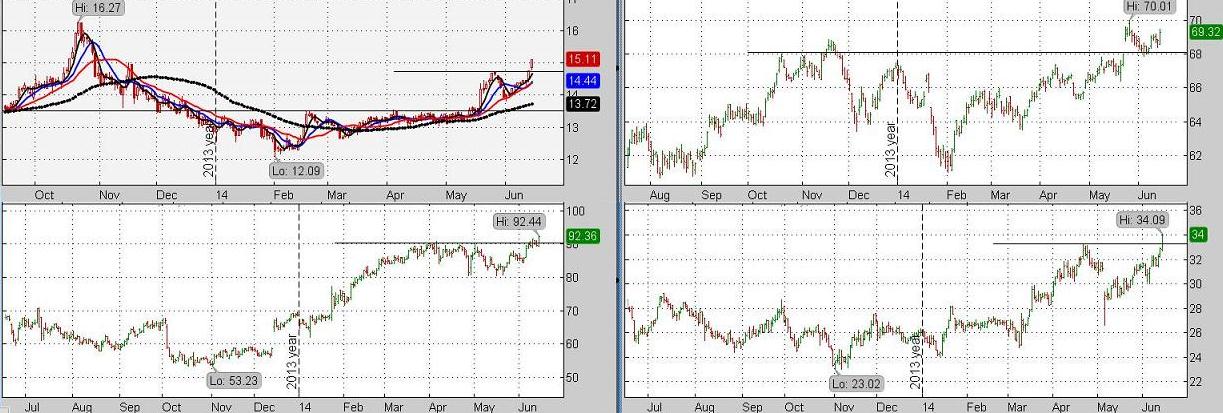
Although we do not provide charts, we want to illustrate the kind of patterns that are detected by our algorithms. The following charts are of the stocks that were found in a scan conducted on a single day. The names were omitted from the charts to provide more space for the chart and because the names are not really important. There are all kinds of great setups here. We have drawn a few lines to help you see them, but The Valuator will often report cup and handle formations, new highs, consolidation-surge combinations, or breakouts through resistance. All these actions will be noted somewhere in the top ranks of strength, the RSI, the CCI, or the 10-day momentum. Rank the scores in each column of The Valuator and create your own lists. Alternatively, just chart the stocks that have a high rating in one or more columns. For example, look for breakout patterns in the stocks highly ranked (90%) in th “Strength Rank %” column.
On any given scan date, there may not be any stocks that fit a specific looked-for pattern (even though we scan thousands). Remember that the purpose of a scanner is to save time. To find all the stocks that have had a breakout, for example, would be an overwhelming task without using a search algorithm. However, The Valuator cannot report something does not exist in the market at the time. Another point worth mentioning is that algorithms are mathematical equations. They cannot “see” nuances that are obvious to a human.