Stops
Stop Loss Calculator
The Welles Wilder ATR Stop Loss System
The Average True Range (ATR) is the average of the True Range over a given period. It is a measure of volatility first introduced by J. Welles Wilder in his book, New Concepts in Technical Trading Systems. Wilder recommended a 14-day average of the True Range. (Periods ranging from 5 to 21 days or more have been recommended, depending on the nature of the security traded and the anticipated holding period.) According to Wilder, large ATR values tend to occur at market bottoms after a panic sell-off (volatility is high). Small Average True Range values tend to occur when volatility is low. An example would be during times of prolonged sideways movement (as when a market is topping out or undergoing consolidation).
Stocks will sometimes gap up or down. A volatility formula based only on the high-low range would not accurately capture volatility when gaps occur. Wilder’s Average True Range can capture this “missing” volatility. The Average True Range measures how much fluctuation or “noise” there is in a trending stock’s behavior. If a person wants to place his stop loss outside this envelope of noise, then he will multiply the ATR by a factor greater than 1. For example, he may multiply the ATR by 1.5 and use the result to calculate his stop. This would help prevent getting stopped out prematurely and will also limit his risk in the trade. Some will prefer a stop that is a greater distance outside the noise envelope and multiply the ATR by a number greater than 1.5. However, there is another consideration. Expert traders prefer to limit risk to 1/3 their potential profit on a position. They will, therefore, use a multiplier that limits the risk accordingly. If doing so means they must use a multiple less than 1, then they might conclude that the risk of being stopped out by mere noise is too great and “walk away” from the trade. [Note: some trading strategies do allow ATR multiples of less than 1]
Most successful traders use stop losses. Most will also agree that stop losses that factor in the volatility of a stock are the best to use when there is no clear indication of a nearby support level on the chart. Stop losses based on the Average True Range (ATR) of a stock are volatility-adjusted stop losses. The “standard” approach is to subtract the ATR (usually multiplied by a “weighting” factor) from the highest close since purchase, but there is wide variation in how the ATR is used. Some trader/investors subtract the multiplied ATR from the highest high reached by the stock since its purchase. Others subtract it from the highest close or from the highest low since purchase. Some use the ATR without using a multiplier. Your choice of multiplier will be determined by your tolerance for risk and your preferred investment time-horizon. For example, if your goal is to capture most of a 1-month move, your stops will be much closer to the current stock price than if your goal is to capture most of a 6-month move. The potentially much greater returns of shorter-term investing come at the cost of greater trading activity. Longer-term investing will generally require less trading activity but returns come at the cost of more downside tolerance (greater risk is tolerated). The trade-off in using this more “relaxed” approach is the likelihood of a significantly smaller return. Each individual must decide where his own “sweet spot” is regarding activity level, potential return on investment, and tolerance for risk. Thus, a person interested in a short-term time horizon might use the ATR without applying a multiplier, while somebody with a longer time horizon might multiply the ATR by 1.25, 1.5, 2.0, 2.35, 3.25, 3.5, or some other number. As you can see, the number of ways the ATR can be used is infinite, so you can use it in a custom-designed way to suit your personal tolerance for risk.
Trade Allocation
Lets say you want to buy XYZ and you have 50K in your account. First, determine what you are willing to risk on a trade. Let’s assume your risk tolerance is 1% of your 50K. That means the most you are willing to lose on a trade is $500. Now the next step is to figure out the ATR for XYZ. Assume it is $1.52. This means XYZ has had an average price range of about $1.52 per day over the last 14 trading days (assuming a 14-day ATR). Assume you want to use an ATR multiplier of 2. Then 2 X 1.52 = 3.04. That is, your stop will be $3.04 from your entry, assuming today was your entry day. If the maximum risk you are willing to take is 500.00, divide 500 by 3.04 to get 164.47. You can buy 164 shares of XYZ. If your stop loss is triggered, you will lose about $500. Once the stock begins to move, you can set the stop loss relative to the high, low, or close each day, but you never lower it on any day after your purchase. With this subscription it is not necessary to calculate the ATR because the ATR is computed for you. You would simply take the difference between your purchase price and your stop loss price and divide that into the amount you are willing to risk on the trade to determine the number of shares you can buy.
The ATR is a great tool for determining where to place a stop loss because it increases when volatility increases. Therefore, as the core of the stop loss calculation, it results in wider stops when market volatility increases and closer stops when volatility is less. As suggested above, most will multiply the ATR by a number from 1 to 5, but some will use a number less than 1 (day-traders might) or more than 5.
For example, a stop loss that is twice the ATR below the close might be used by some for a short-term stop placement, three times the ATR below the close might be used for a medium-term stop placement, and four times the ATR below the close might be used for a longer term stop placement. As of this writing, Yahoo had a closing price of 44.34 and an ATR of .8473. The above calculations would be as follows.
44.34 – (2 x .8473) = 44.34 – 1.6946 = 42.645
44.34 – (3 x .8473) = 44.34 – 2.5419 = 41.798
44.34 – (4 x .8473) = 44.34 – 3.3892 = 40.951
The most common multiplier is 3 (a recommendation of Wilder), but you might not anticipate the same holding period as most people. Therefore you must decide for yourself what multiplier to use.
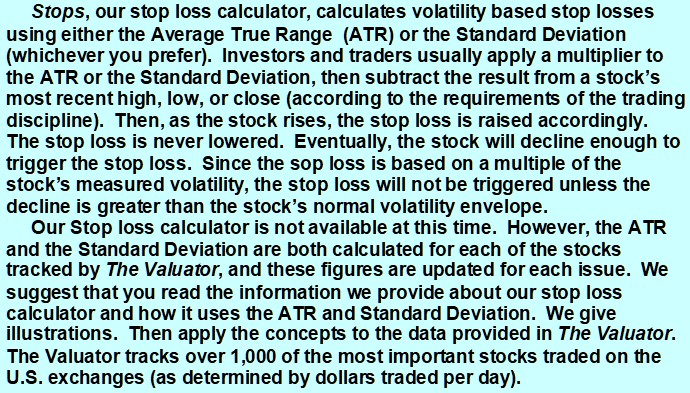
To give you some idea about what the use of different multipliers can mean for stop loss placement, we have found a stock with numerous reversals to illustrate the point. Below are five charts showing a stop loss relative to the closing price each day (red line). They show stop losses calculated by multiplying the ATR by 1, 2, 3, 4, and 5, respectively. Imagine you have bought at any place on one of the charts. The red line directly below the price bar on the day of purchase represents your stop loss on the purchase date. As the stock rises, you adjust your stop loss accordingly, using your chosen multiplier and the ATR for the current day. Eventually, the stock will decline. When it drops enough that it reaches the level of the highest point reached by the red line since your purchase, the stop loss is triggered and the stock is sold. Most people place the stop order to sell with their broker so that they do not have to monitor the stock during the day. Then, in the evening, they adjust the stop loss for the next day.
In the following illustrations, the red line rises and falls with the stock. In actual practice, stop losses should only be raised as the stock rises. They should never be lowered. It is always at the highest level reached since purchase. When the stock declines, the stop loss does not. However, if we did that with the illustrations, the red line would go flat or disappear the first time the stop is triggered. This way, you can imagine buying at any point on the charts.
1 x ATR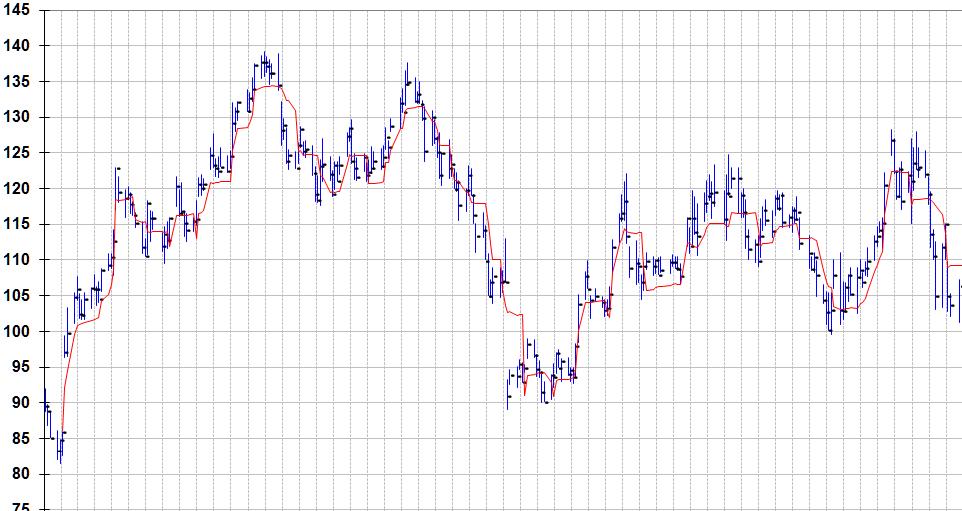
2 x ATR
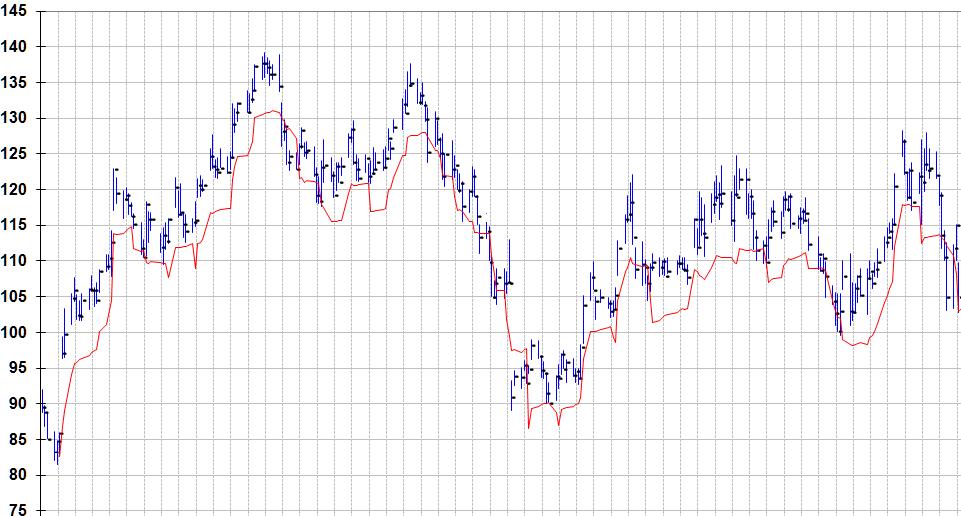
3 x ATR
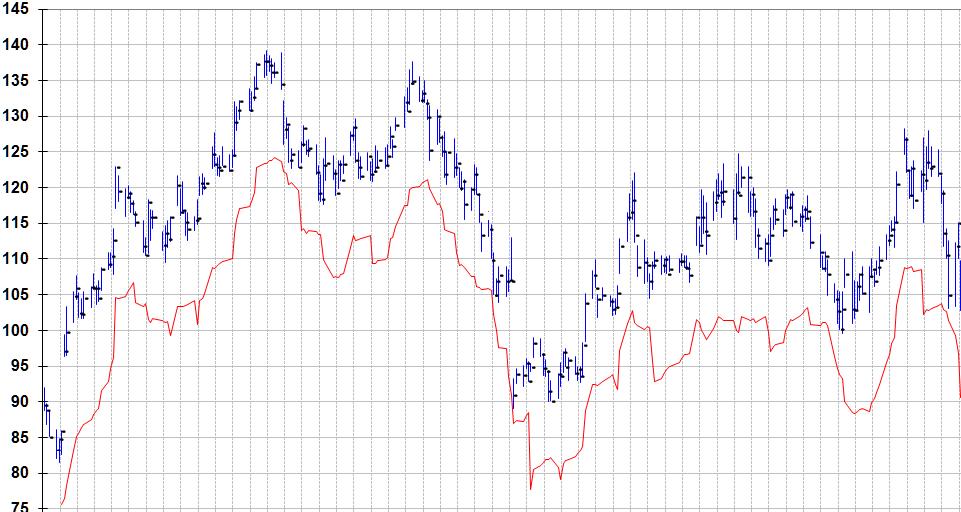
4 x ATR
5 x ATR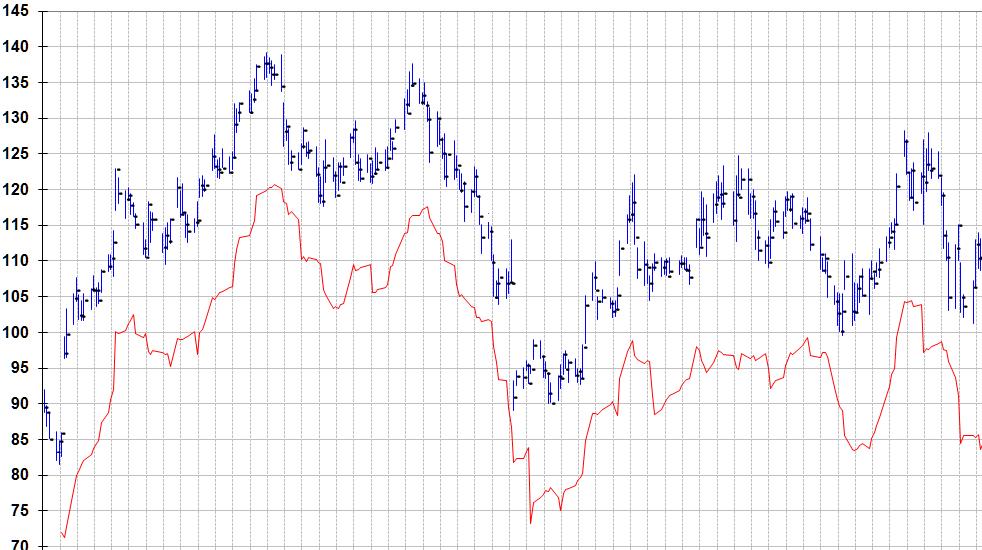
The True Range is the largest of the following calculations:
Most recent day’s high minus the most recent day’s low
Absolute value of the most recent day’s high minus the previous close
Absolute value of the most recent day’s low minus the previous close
Absolute value of the most recent day’s high minus the previous close
Absolute values are used because direction (+ or -) is not important. Wilder wanted only to calculate the distance between two points.
From the above, you can see that the ATR is a very conservative measure of the average change in price from one day to the next. What we mean is that the ATR does not take the actual change in closing price each day and average those changes. Instead, the ATR is determined by computing the maximum of several ranges from one day to the next. This range is generally greater than the actual change in closing price and it factors in any price gaps from one day to the next.
To calculate a 14-day Average True Range (ATR), for example, a person would make the above calculation for each of the most recent 14 days of price action and then average those computations. The “normal” ATR calculator would require that you input the date, open, high, low, and close for each day of the last 14 days for each stock. Our calculator does not, because the required data is already “built-in.”
Our Stops calculator uses the same approach to data “smoothing” as that specified by Wilder’s formulas and procedures. Many ATR calculators use a simplified smoothing approach. People get used to using shortcuts, then they incorporate those shortcuts in the calculators they create. The procedures they use are not the ones recommended by Wilder. This is a generalization. Some calculators may actually use Wilder’s mathematics and procedures. Because some people looking for a stop loss calculator end up with a tool that does not strictly follow Wilder, We make a point of the fact that Stops does not use shortcuts or a watered-down approach. You do not have to know how to make these calculations because Stops provides the ATR for you. A person can use the Standard Deviation in the same way the ATR is used. Both measure volatility, The S.D. and ATR Will likely need different multipliers to get your desired result. So, you will have to experiment to determine what multiplier tends to place the stop loss the right distance from the stock (according to your own tolerance for risk). Do this for both the S.D. and the ATR. The more risk you can tolerate, the farther you will place the stop from the stock. The Valuator also provides Standard Deviation and ATR data.
Note: Many traders prefer the ATR over the Standard Deviation for stop loss calculations because the ATR adjusts for gaps and intraday price surges that are not usually included in Standard Deviation measurements. There are ways to compensate for these events while using the Standard Deviation. For example, a person could calculate the average or maximum surge and gap size over the measurement period and adjust the Standard Deviation calculation to reflect those events. Or, a trader can use intraday data to calculate the Standard Deviation. A person could also use a multiplier that is sufficient to include intraday surges, etc.
Get information on our free stop loss calculator
Note: Our stop loss calculator is not available at this time.