Center of Gravity
Below, we describe a new approach to finding value that takes far less
waiting time to obtain a profit than traditional approaches
Over the years, value investors have tried to use earnings to evaluate how much a stock is worth. To do that, they depend on analysts to come up with the value of stocks based on earnings, cash flow, and a number of other metrics. Some analysts use earnings, etc. from last year (old and outdated data) and some use estimates for one year ahead to determine future value. However, analysts have a history of being notoriously wrong when making estimates that far ahead. For over 30 years, The Valuator has used financial data for the previous 6 months and combined it with analyst estimates for the next 6 months as a basis for determining value because analysts are much more accurate when looking ahead only 6 months. Even here, though, analyst reports come out only once every three months. Things can happen that will dramatically change the outlook for a company during those three months.
We have therefore decided to try an entirely different approach. The purpose for using earnings and other financial data to determine “value” is to be able to make a profit by buying when a stock is undervalued and selling when it is fairly valued or overvalued. Breaking this down, we don’t really care if we get “value” for our money as long as we get “profit.” what we really want is continuously updated information so we can buy when the price is low and sell when it is higher. This does not require the use of analyst reports. The market itself can tell us when a stock is low and likely to generate a profit. The market knows how the company is doing financially, long before the analysts make their reports. Here is what you should consider.
A stock’s chart pattern of price and volume reflects all that is known by the market. That is, it reflects all the knowable information about a company at any given time as well as the opinions of all market participants regarding that information..
That does not mean that the price and volume as displayed on a chart completely reflects everything about the company or that current prices FULLY reflect all that is known, because what is known by some is not yet known by all. However, a company’s chart does reflect to some degree what is known by the few who know it. In other words, the current patterns, momentum, and trends that are evident in the chart of a stock do reflect what is known to the extent that it is known. What is known by the few may not yet be fully mapped onto the chart, and will only be so after the market’s participants fully absorb and act on that information.
Say that the employees of ZYX have modified one of their major products. Since that modification, orders have surged. Why? The employees of ZYX know that they now have a product that will be “hot,” and that earnings are going to surge dramatically as a result of all the new orders that will be coming in. Those employees, in their excitement, tell their families and friends about what is happening at work and about the increasing demand for what they are manufacturing. The families and friends decide that they want to own some stock in ZYX. As they begin to buy, the stock rises and the volume increases. The stock is indeed rising because of what is known. However, what is “known” is not known by everybody. To the extent it is known, it is mostly reflected in the chart.
The employees of ZYX’s main component supplier see a significant increase in orders from ZYX for the supplies it needs to manufacture their product, and the supplier knows that the product has just been upgraded. Because ZYX is ordering several times the normal amount of the components needed by the product, the employees of the supplier know that ZYX is expecting or has received a huge influx of orders. Therefore, the supplier’s employees and their families and friends begin to buy ZYX stock. The stock rises more and is now clearly in the early phase of an up-trend. When the chartist looks at the chart, he sees the trend begin. Yes, the trend reflects what the market knows about ZYX, but the whole market is not yet privy to the information. However, the chartist sees the trend as possessing momentum. Something new is happening with ZYX and that trend is probably only the beginning. Continuance is the nature of a trend. The beginning of the trend reflects what has been discovered by the most informed. The chartist will want to buy because he knows that what is known by the most informed has not yet been learned by the less informed. The dissemination of information is a process. It does not occur instantly. The new trend on the chart is also in a process of development. The chartist sees that the stock has broken through resistance, changed direction, or perhaps a short-term moving average has crossed above a long-term moving average. In other words, he sees a “buy” signal on his chart.
Competitors of ZYX know the suppliers of ZYX because, being competitors, they use the same or similar supplies. Therefore, the information spreads to the employees of the competitor (and to their friends and neighbors) who also begin to buy stock in ZYX. The trend continues to build. Now one of the analysts of a major brokerage house asks probing questions of the supplier to find out why the supplier is selling so much more of the components used in the manufacture of ZYX’s product. The supplier mentions that there has been a big boost in demand for those supplies from ZYX. The analyst now reports that fact to his firm’s brokers. The brokers begin to recommend the stock of ZYX to their clients. The trend grows and volume increases.
Now other technicians see the strengthening trend in ZYX’s stock price. The information is spread through their networks. A stock market pundit now appears on a national television program and recommends the stock of ZYX. People all over the country now begin to talk about ZYX, its product, and its stock. More people want the stock. The story then begins to be told in other countries.
There has been no additional information beyond that originally known only by the employees of ZYX. It has just been made available to increasing numbers of people in various ways. While it is true that the electronic transmission of information is practically instantaneous, it is not disseminated instantaneously because people are not instantaneous. People react at different speeds, and they become aware of published data at different times.
The traders at stockdisciplines.com understand and act on the fact that new information that is known by one part of the market, is still being discovered by another part of the market, and is yet quite unknown to the rest of the market. Even so, stock charts do reflect all that is known to the extent to which people have acted on that new knowledge. The rest of the market will learn about it later. When they do learn about it, the charts will show at that time that others have acquired the information. That is why trends continue and breakouts can be profitable to those who see the early signs. Those who do are usually market and stock pattern technicians rather than fundamental analysts with their quarterly data. When the chart shows that the trend is coming to an end, it is because the sellers are beginning to more than balance out the buyers. The technician will see this in the charts and know it is time to sell.
The point is that new information begins to be priced into the action of a company’s stock long before the analyst makes a report about it. After his report, the market continues responding to more new information as it develops. The new drug that was highly touted by the analyst a month ago has had a test failure that indicates it will not successfully treat a health issue, and the stock has begun to fall. The analyst does not report the failure for another two months. Thus, investors who depend on analysts for their information, will be behind the knowledge curve most of the time. However, the stock’s behavior reflects new information as it becomes known by employees, suppliers, competitors, and chartists. It just does not reflect it fully instantly. The same thing is true when an analyst issues his report. The difference is that during the time between those reports, the stock is already sending out messages. So, how do we use the behavior of a stock to accomplish the same thing we tried to accomplish by buying a stock when it is undervalued?
Take a look at any stock chart covering a year or more. Add to the chart a moving average. Notice that most stocks swing above and below this average. This excursion above and below the average can be considered to be “noise.” In fact, stockdisciplines.com traders know that institutional investors watch “noise” patterns, and sometimes use them for timing their purchases and sales. If you look closely at the chart of a stock with a strong uptrend, you will notice that the stock will occasionally pull back until it reaches its 50-day moving average, then it rebounds strongly off that moving average and continues climbing. Then, it pulls back again and rebounds again. That’s because institutional investors consider a stock that has pulled back to its strongly rising 50-day moving average to be a low-risk investment. They can follow the stock up with a sop loss just below the 50-day moving average when they buy, and move the stop loss up as the stock climbs from there. They can repeat this process over and over again. the odds favor a rebound when a stock declines to a rapidly rising 50-day moving average (30º angle of ascent or greater). In this example, the “noise” is one-sided. This example was used to show that institutional investors do watch noise patterns. Now, what about most stocks that do NOT have a rapidly rising angle of ascent? In this case, the “noise” tends to be two-sided. The charts of the vast majority of stocks show that prices oscillate above and below most moving averages, whether the averages are rising or falling.
The same kind of thing happens with respect to what we call the C.G. (“Center of Gravity”) of each stock. The stock’s price oscillates above and below the C.G. The stock’s behavior can be described in terms of a cloud of probability points around the C.G. We start by defining the C.D. of a stock. Then we use a mathematical procedure to map the stock’s probable range of excursion on either side of its C.G. (the C.G. moves because it is constantly adjusting to investors and their reactions to the ongoing flow of data, both economic and company-centered). We can determine, for example that there is only a 10% probability that a stock will decline to $10, or some other figure. Thus, we can know that $10 is cheap for the stock at this time, because it is at an extreme distance from its C.G. There is a 90% probability that the stock will now move back toward the C.G. We can consider the C.G. to be a kind of gravity well or “Center of Gravity.” A stock that is at an extreme distance above or below its C.G. will tend to reverse course and return to the C.G. There is a regression to the mean that becomes more and more probable the farther the stock moves away from the average. Therefore, instead of waiting 3 months for an analyst to make a report in which he estimates value by using outdated data or inaccurate pie-in-the-sky projections, we can use the Center of Gravity of the stock’s excursion pattern that is constantly changing in real-time. We use fresh data for each issue, and that data reflects, to some degree, the most recent information to the extent it has been acted upon by investors. It is not like the analyst’s data and guesses that are up to three months old. While it is true that this “Center of Gravity” is changing from day to day, it is also true that an analyst’s estimates will change from quarter to quarter, if he updates his data. There is nothing wrong with a moving target price, especially if you don’t have to wait 3 months for an analyst to tell you where it is.
Therefore, for the stock’s target price, we use a stock’s “Center of Gravity” or “C.G.” in place of “fair value.” It is the price of greatest probability and the focal point of a stock’s gyrations. It is more consistently current than an analyst’s reports. Also, it is likely that the stock will reach its C.G. faster, since at an extreme excursion, it is likely to return soon to its “Center of Gravity” rather than drift aimlessly while waiting for people to see “value” in its price. We take advantage of the “harmonics” of stock behavior. These “vibrations” do not have a fixed frequency, but it is likely that a stock’s price will return to the C.G. within days or weeks rather than the years it may take as the stock meanders toward “fair value.” All we need to do is have a wide selection of stocks and focus on those that have moved far enough away from their “C.G.” that they are likely to give a nice profit. Stocks swing above and below their C.G. whether they are high or low relative to “fair value.” If a stock is 10% or 15% below its C.G. and if it has a rising 10-day moving average, it is probably on its way to a meeting with its its C.G.
The Valuator flags stocks that have at least 10% to rise before reaching their C.G. and that have a rising 10-day moving average. It also flags stocks that have at least 6% to rise before reaching their C.G. and that have a rising 10-day moving average. The decision to buy can be based on this distance and such other factors as a low PE ratio (provided), a “Strength” reading (more robust than the RSI), a velocity reading, a dividend yield reading, or a “Buy” reading generated by the Donchian dual moving average system. The Valuator also indicates the direction of the 20-day moving average for each of the last three consecutive 20-day periods and the magnitude of its change for the last 20 days.
“Fair Value” Guestimates vs. Center of Gravity Measurements
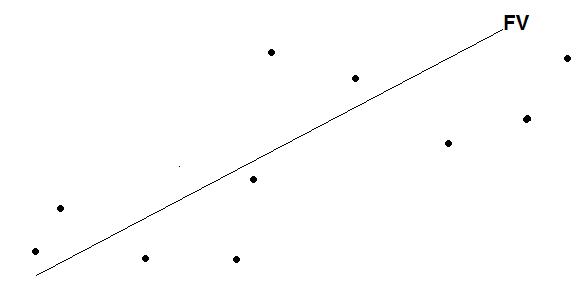
The above illustration is idealized. It assumes the “Fair Value” of a stock is in a strong uptrend. The analyst makes positive comments about the company once every three months. The dots are the price of the stock at different times. Sometimes the price is above fair value (overvalued) and sometimes it is below fair value (undervalued). That is why an analyst can say a stock is a bargain or that it is over-extended. However, analysts are notoriously wrong when projecting what a stock will be worth in a year. You may have had the experience of investing in a stock that was highly recommended by analysts, a stock that should double in a year, only to discover that it only drifted sideways or declined over the year.
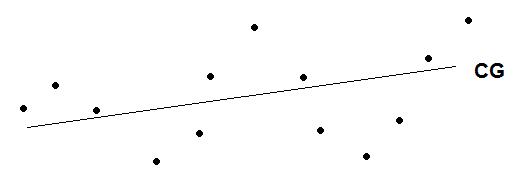
The above illustration is an attempt to show that a stock also swings above and below its Center of Gravity. To picture what we mean, imagine a scatter plot with a linear regression line drawn through the dots. The dots will be on either side of the line. Something similar happens with the Center of Gravity. The dots may not deviate as far from the line as they do with “fair value,” but the current price will probably, but not necessarily, cross over the line more frequently. With a C.G. buy/sell strategy, we will likely be using a compressed (shorter) time horizon and focusing on generally smaller excursions from the mean. So, profits may be smaller but come sooner than when using a “fair value” approach. The CG line is current as of the last market data before publication. It is absolutely accurate because it is generated by the action of the stock itself, and the stock is responding to all that is currently “known” by all the investors in the stock (including what they have learned from analysts, and including the actions of employees of the company and of the company’s suppliers and competitors). It is not based on guesses of analysts issued once a quarter.
So, a person can look for stocks that are below their CG and that have positive momentum. If the 50-day moving average is rising, the odds favor the price reaching the CG or higher. If the 50-day moving average is declining, the stock may be able to reach its CG, but we would not bet on it rising above it. If the Stock is above its CG, has positive momentum, and if the 50-day average is in a strong uptrend, the stock is likely to continue rising a while longer. However, if it has negative momentum, it may soon return to its CG. There are other factors that can be considered in order to refine the discipline and improve on its reliability. The Valuator has a number of metrics that can be used in such a system.
What we are saying is that if a person customizes a strategy based on Center of Gravity, it should be at least as effective a a strategy based on Fair Value. In our view, the guesswork of analysts would not be nearly as reliable as the up-to-the-date-of-publication statistical pattern of a stock’s behavior over the most recent 50 days.