McClellan Oscillator and Summation Index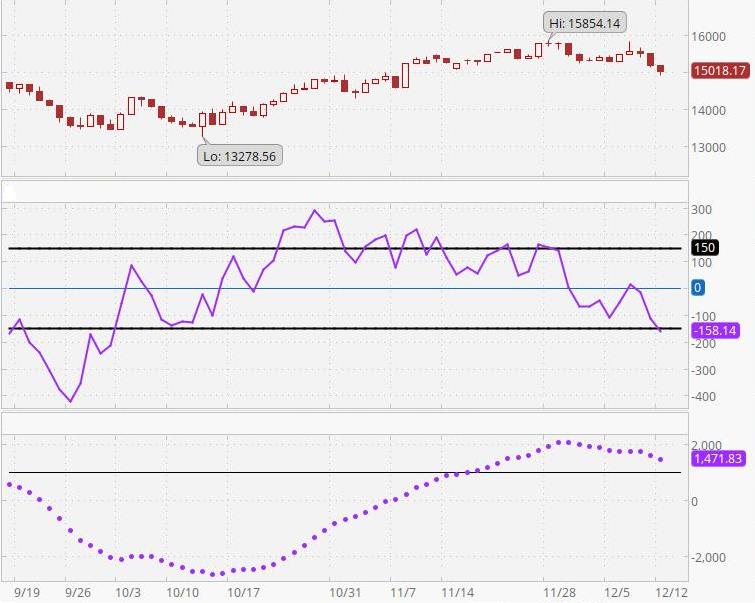
The first chart above is the NYSE Composite Index, the second is The McCkellan Oscillator, and the third is the McClellan Summation Index. The McClellan Oscillator is a breadth-of-market indicator that is effective for interpreting short-to-intermediate-term market moves. The McClellan Summation Index (bottom chart) is a running total of each day’s McClellan Oscillator value. The Summation Index is effective for interpreting intermediate to long-term market moves. Together, they can be useful in evaluating the dynamics of the ebb and flow of the market, and in planning entry and exit points. The readings indicated depend on the precise time the readings were taken. For example, after the market officially closes, stock prices may continue changing by small amounts for a short time as computer systems catch up with closing activity. Readings at the official closing time may be slightly different from those 15 minutes after the close. Thus, different sources may report slightly different readings. Another variation is caused by differences in the beginning date of the accumulated data. These variations are not particularly important. What is important is the pattern of each indicator. Even though different sources may provide somewhat different numbers, the chart patterns from any two sources will be nearly identical.
McClellan Oscillator readings of ±150 are extreme and tend to correlate well with buying and selling climaxes in the market. The McClellan Oscillator reaches these extreme values, measuring overbought and oversold conditions, in advance of market turns. It then passes through zero (the black dotted line) at or very soon after market turning points (to put this in perspective, extreme readings occur much less frequently than a pass through zero. McClellan Oscillator passes through zero tend to indicate market reversals at approximately 2 to 6 week intervals). The type of action to be taken, if any, depends on the major trend of the market (as indicated, for example, by 50 and 200-day moving averages) and on whether the move originated from an extreme reading. Thus, in the early and middle phases of a bull market emphasis might best be placed on buy signals. In a bull market, buy signals occur earlier, and positions can be taken when the McClellan Oscillator clearly moves out of its basing pattern, even if it is still negative. In a bear market, sell signals occur when the oscillator moves clearly out of a topping formation, even if it is still positive. The amplitude of the oscillations above and below zero correlates with the general volatility of the market. The oscillator shows distinct cycles (lasting 22 to 24 weeks) between significant bottoming formations. Divergence between oscillator moves and conventional market indicators forecasts an impending change in market direction. Conventional trendline theory can be applied to oscillator patterns. For example, a triple top formation in the McClellan Oscillator forecasts a termination of the preceding up-trend.
The Summation Index is a relative number, depending on the day when the count begins. Therefore, on one day it might read 10,000 and the next day it might read 9,000 even though the chart shows the Index rising. In this case, the apparent discrepancy would simply be the result of the summation starting on a later day for the chart selected. You can get a better sense of what is going on by simply looking at the chart. Ask yourself questions like the following. Is the Summation Index rising or falling? Are the postings far apart or close together? For example, if the Summation Index is rising (or declining), it is intermediate-term bullish (bearish if declining) and the market’s trend is up (down if the Summation Index is declining). If the Summation Index is declining, the first positive sign will be a slight narrowing of the gaps between postings. The second positive sign the Summation Index will give is a flattening out of the entries (this stage is sometimes skipped). The third positive sign is a reversal in direction. The final positive sign is a slight increase in the distance between postings. Some investors use the latter as a buy signal (alternatively, some may use the second posting in the new direction as an early buy signal). They view the opposite conditions as negative, culminating in a sell signal.