
Various ATRs Illustrated
In the following illustrations, the red line rises and falls with the stock. In actual practice, stop losses should only be raised as the stock rises. They should never be lowered. It is always at the highest level reached since purchase. When the stock declines, the stop loss does not. However, if we did that with the illustrations, the red line would go flat or disappear the first time the stop is triggered. This way, you can imagine buying at any point on the charts.
1 x ATR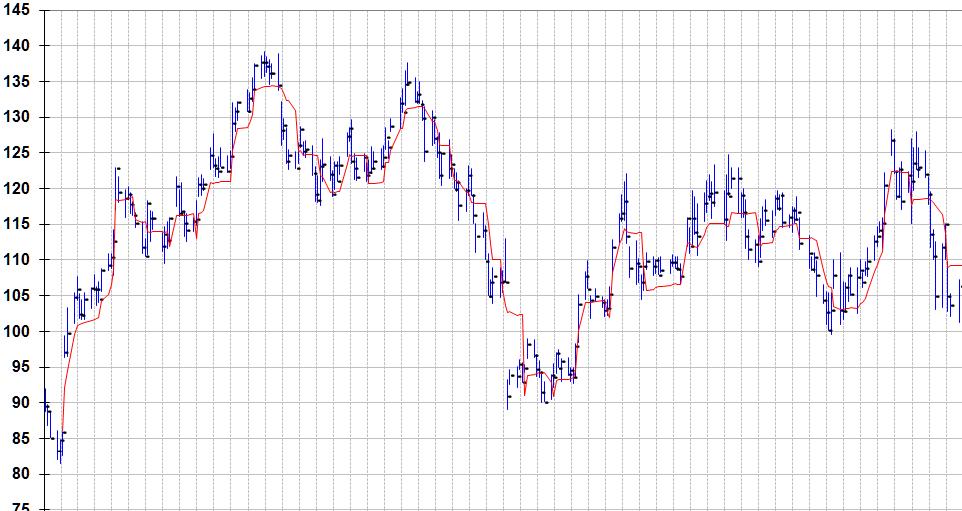
2 x ATR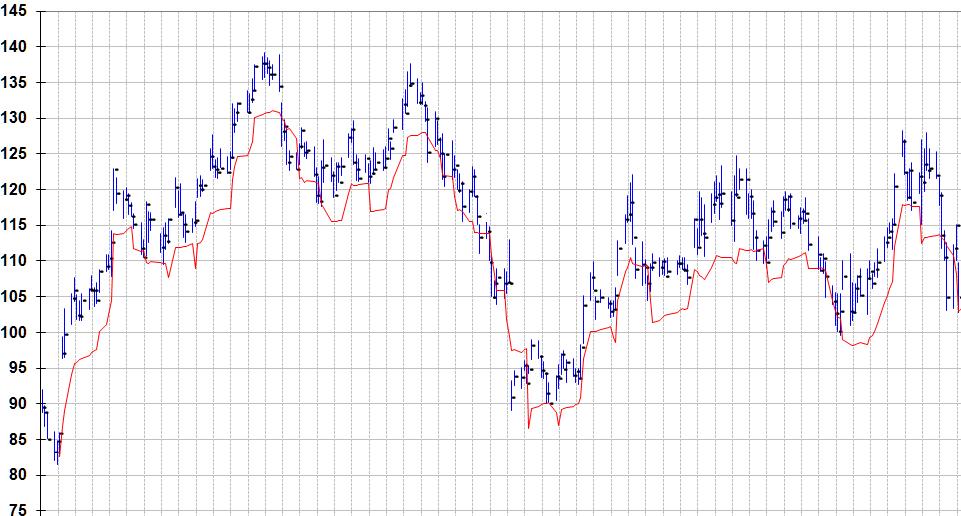
3 x ATR
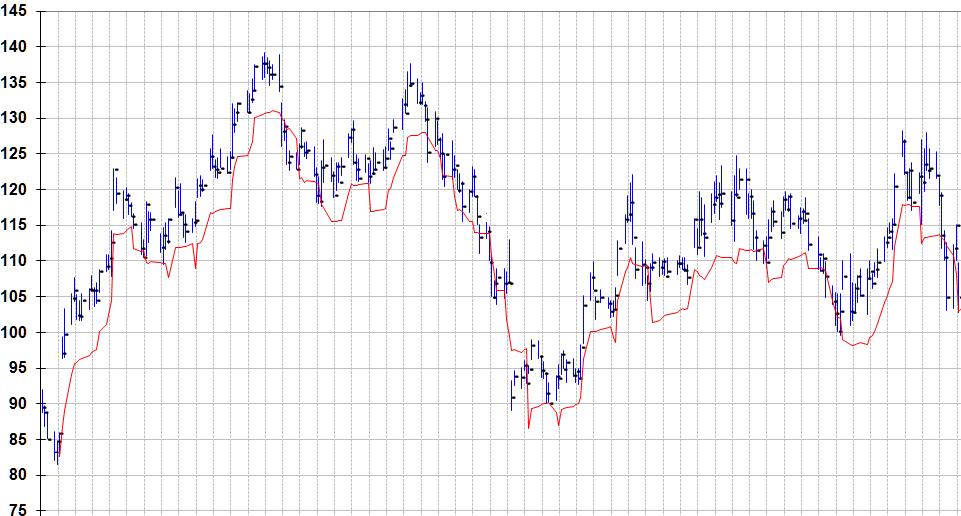
4 x ATR
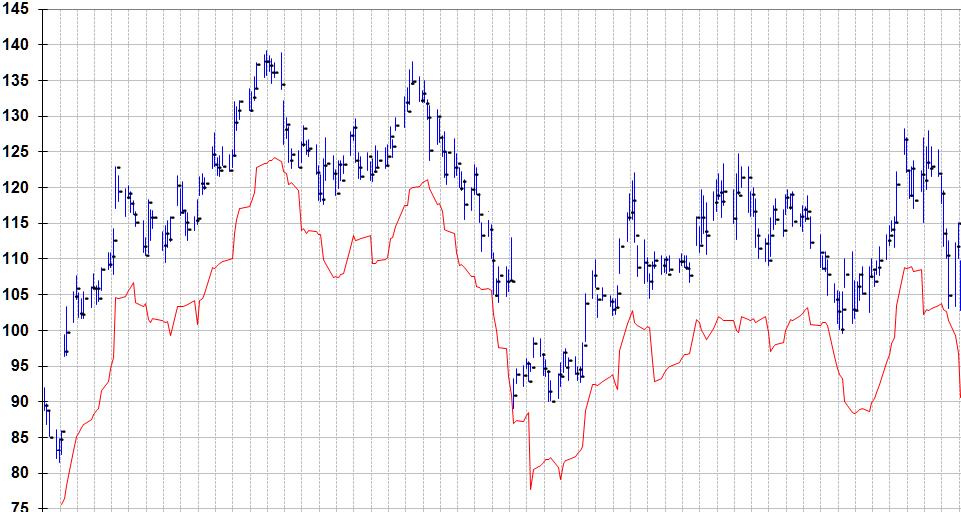
5 x ATR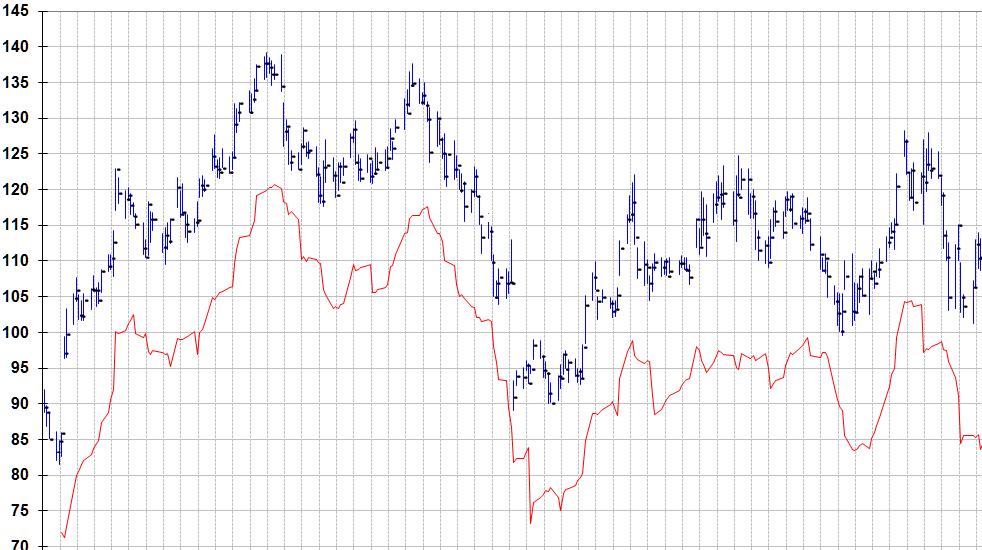
The True Range is the largest of the four following calculations:
Most recent day’s high minus the most recent day’s low
Absolute value of the most recent day’s high minus the previous close (see “A” below)
Absolute value of the most recent day’s low minus the previous close (see “B” below)

Absolute values are used because direction (+ or -) is not important. Wilder wanted only to calculate the distance between two points.
From the above, you can see that the ATR is a very conservative measure of the average change in price from one day to the next. What we mean is that the ATR does not take the actual change in closing price each day and average those changes. Instead, the ATR is determined by computing the maximum of several ranges from one day to the next. This range is generally greater than the actual change in closing price and it factors in any price gaps from one day to the next.
To calculate a 14-day Average True Range (ATR), for example, a person would make the above calculation for each of the most recent 14 days of price action and then average those computations. The “normal” ATR calculator would require that you enter the date, high, low, and close for each day of the last 14 days for each stock. However, on a weekly basis, The Valuator provides a fresh calculation of the ATR for each stock tracked.
We use the same approach to data “smoothing” as that specified by Wilder’s formulas and procedures. Many ATR calculators use a simplified smoothing approach. People get used to using shortcuts, then they incorporate those shortcuts in the calculators they create. The procedures they use are not the ones recommended by Wilder. This is a generalization. Some calculators may actually use Wilder’s mathematics and procedures. Because some people looking for a stop loss calculator end up with a tool that does not strictly follow Wilder, we make a point of the fact that The Valuator does not use shortcuts or a watered-down approach. The Valuator can also help you calculate stop losses based on the standard deviation. The column “Probable 90% & 68% Lo-Hi” will give you the standard deviation of a stock if you get the difference between the bottom two numbers in a cell and divide by 2. Then you multiply the standard deviation by the amount that gives you a comfortable distance below the price of the stock (Low, High, or close). The stop losses calculated by using data in The Valuator, are volatility-based stop losses. We consider these to be the best kind of stop loss. Also, the stop losses are based on the last 50 days of the stocks price action.
The following are some of the features of Stops
1. Precisely uses Wilder’s original equations
2. It can provide information needed for standard deviation stops
3. You do not have to calculate the ATR or standard deviation for each stock
4. You do not have to enter stock data for many days
Most of he following paragraph was written when we charged a fee. We have included it here to make a point.
A couple can get a 1-day ticket to Disneyland for $234. For that, they may get a few rides and have the privilege of buying things in the park. Once that money is spent, it is gone. On the other hand, paying to The Valuator for 6 months costs much less, and it can be used to increase your assets rather than diminish them. It has the potential to save the user far more than its cost. Think of it this way. If you save only $1 per share on a single 500 share position by using a volatility adjusted stop loss to sell a little earlier when a stock begins a decline, you will save about $500. Hypothetically, you could multiply that by the number of positions in your portfolio. Also, when you replace those positions, there is the possibility of saving on the new positions as well by making timely purchases. Of course, we cannot guarantee that you will save anything on any position, because stock behavior cannot be predicted accurately, and individuals will vary in how they use The Valuator.