Original price was: $25.00.$0.00Current price is: $0.00.
See description lower on this page.
Description
ETF Alerts
If you invest in ETFs and would like a tool that can help you get in at the beginning of a new up-trend or get out when the trend is just beginning to trend down, we think you should give serious consideration to this service.
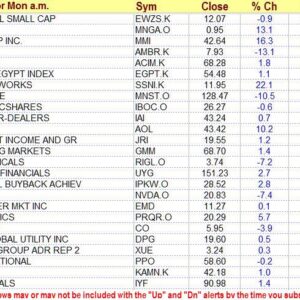
ETF Alerts generates alerts for five moving average crossover systems and it provides an RSI measurement that can be used to reduce the probability of buying an ETF that is likely to reverse course immediately after you buy it. Alerts are generated for the 30-day, 50-day, 100-day, and 150-day moving averages. All alerts are generated when the 5-day moving average crosses the longer moving average. We also include a Donchian crossover system. That is, a signal is generated when the 5-day moving average crosses the 20-day moving average.
The crossover of any moving average by the closing price is notoriously subject to whipsaws (signals that are reversed the following day or soon after). Many traders therefore require that the crossover be sustained for several days before they act on the alert. Alternatively, they might use a short moving average versus the longer moving average. In our algorithm, in order to detect more meaningful crossovers and to cut down on whipsaws, the formulas use a 5-day moving average cross of the longer moving average rather than a cross by the closing price of the longer moving average. The purpose is to obtain more trustworthy signals than the simple cross of the closing price versus the longer moving average. The tradeoff involved in using a 5-day moving average to generate signals is that it is slower at generating a signal than the closing price would be. However, we believe that when the signals are generated they are less likely to be false signals.
For example, a cross by the 5-day moving average of the closing price from below to above the 30-day moving average will generate a “30-Up” alert. A cross by the 5-day moving average of the closing price from above to below the 30-day moving average will generate a “30-Dn” alert. Similar alerts are posted for the other four moving averages. The idea here is that when a new trend begins, an early sign will be a crossover of the moving average by a short moving average.
The moving averages used are all simple moving averages. Our tests have convinced us that although exponential and weighted moving averages are a little faster than simple moving averages, simple moving averages produced better total returns on average. That is, simple moving averages made greater profits for most stocks most of the time. For additional information on simple vs. exponential moving averages, go to http:/www.stockdisciplines.com/best-sell-strategy
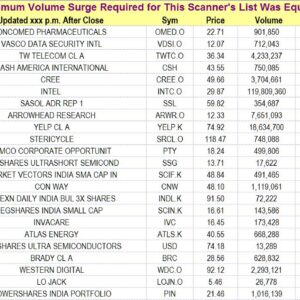
We also include the 14-day Relative Strength Index (RSI) for those who would like to incorporate a short-term strength measurement in their system. For example, a crossover with a surge in price would register a higher RSI than a crossover without a surge in price. An ETF with high relative strength at the crossover is less likely to reverse course immediately to generate the opposite signal. We also provide volume surge information for the day on which an alert take place. That way, a person could, for example, concentrate only on crossovers that occur with a 50% or 100% surge in volume.
New investors could experiment by creating “paper portfolios.” They could “buy” an ETF when it generates an “Up” alert and “sell” when it generates a “Dn” alert. A portfolio could be created for each moving average system, with the individual keeping track of the trading activity and profitability of each. Over time, an individual should be able to decide which system gives the best investment experience. What works best for one person may not work best for another. However, when you test these systems, do not slavishly buy on every “Up” alert or sell on every “Dn” alert. Respond as a reasonable trader would. These are alerts, not buy or sell instructions. If you get an “Up” alert, review the stock’s chart and see if there is overhead resistance or some other reason to avoid the stock. The alerts are supposed to alert you to the fact that a crossover has occurred. They are not intended for you to become a slave to them. We certainly don’t use them that way. Out of a list of 20 alerts, we might reject most of them (or even all of them) because of something undesirable about their chart patterns. The alerts are intended to help you become much more efficient by narrowing the field of possible investment candidates. Out of hundreds of ETFs, the alerts show you which ones have satisfied a crossover condition. You must then conduct a visual inspection to determine whether or not you should act by buying or selling.
The advantages of these particular moving averages is that they each have their followers. That means their signals are somewhat like self-fulfilling prophecies. People who believe in the importance of the 50-day moving average, for example, closely monitor their stocks as they approach that average. They know that institutional investors tend to do the same thing. Therefore, when a stock crosses the average, there is often an influx of new buyers who add their strength and support to the new rising trend. Donchian’s approach has a reputation of giving excellent signals, and that system is key to the discipline used by many investors.
Many technicians monitor these moving averages even though some of them do not immediately act on every signal. For them, the averages serve as a kind of stock “direction bias indicator.” When a stock crosses below its moving average, these traders might lighten up on the position, or take on a selling bias toward the stock. Traders and investors react to these moving averages in a variety of ways. The bottom line, though, is that each of these moving averages is extremely important to a very large number of people.
The main menu has a link to “ETF Alerts” Unless you have already been there, use that link to get additional information.
To order, click on “ADD TO CART” at the top of this page.


