Stops-XL Instructions are at the bottom of this page
Neither Stops nor this Website ever recommend
the purchase or sale of any security
From 5/24/08 to 4/23/23 we offered a stop loss calculator, but we had been experiencing piracy and theft. Hence, we had to devote resources to protect our calculator. In 2023, we no longer charged fees and it no longer made sense to invest the time and resources necessary to protect our software. In that year, we stopped publishing the Stops calculator.
We have now decided to try offering a free version of stops. Because we no longer make any money from operating this Website, this new version had to require little overhead in time and expense. We concluded that the best way to minimize overhead and avoid piracy, was to keep all our important algorithms entirely out of the program. It will no longer compute pivot points, Fibonacci retracements or work on any stock for which you can obtain data. However, is can be useful for those who want a simple stop loss calculator that will work for the most important stocks (as determined by average daily dollar amount traded). So, our volatility calculations are now done separately, apart from StopsXL. Then the results are pasted into StopsXL. There are equations in StopsXL that make use of this data, but all the heavy work is done apart from the application. That way, there is nothing in StopsXL for thieves to steal. One benefit of this approach is that we could create StopsXL in the most widely used spreadsheet program without any concern about the security of that program. So, we chose Excel and its .xls format. We use password protection to stabilize the layout and general appearance rather than to protect algorithms. If your system can use Excel, it can use StopsXL. This new version is designed mostly for those who have long positions rather than short positions. However, the volatility measurements can be applied to short positions. The user who is in a short position will have to add the volatility adjustment to the desired figure. The app will not do it for you. For long positions, it will subtract the measurement for you.
We put Average True Range data (14-day) and Standard Deviation data (50-day, 75-day, and 100-day) in the program for each stock covered (over 1,000 stocks). Our concept was that the subscriber would use the calculator for one week and then download a new copy of Stops to get fresh data. It takes less time to download a new copy of Stops than it takes to download fresh data in the usual way. We also ran tests to see what the downside would be if Friday’s data were used until the next update. Our hypothesis was that the changes over a week would be minimal, but waiting longer than that would probably be a mistake. To test this idea, we computed ATR and Standard Deviation data on one Friday for approximately 1,050 stocks. Then we made these calculations again on the following Friday. Then we averaged the data for each week. We were looking for a generalized estimate of how much error might be involved by the end of the week.
Usually a person will weight the impact of the ATR or Standard Deviation measurement by using a multiplier and then subtract the result from the purchase price or subsequent reference price. To keep this illustration simple, we assumed a multiplier of 1. The average price per share in our test (the first Friday) was $144.717. The average ATR at the beginning of this test was 4.439. Using a multiplier of one, and applying the stop loss to the $144.717 price, we get 144.717 – 4.439 = 140.278. A week later the average ATR was 4.149. The average stock price was 145.4688. Using the same formula with the new ATR we get 145.4688 – 4.149 = 141.3198. Now, using the old ATR on the new average price we get 145.4688-4.439 = 141.0298. The result of using the week-old ATR was a stop loss that was 29 cents less than the stop loss derived by using the current ATR. This difference was 0.2 of 1% on a $145 average stock price or 10 cents on a $50 stock. It should be no problem to add .10 to the amount subtracted in deriving the stop loss. Of course, this is just a generalized estimate. However, it can give a you a general guideline as to where a reasonable stop loss might be. You can then “eyeball” the chart and make adjustments to this figure as you deem appropriate.
Now let’s look at the test results for stop losses based on the Standard Deviation. The average Standard Deviation (S.D.) at the beginning of this test was 8.0401. Using a multiplier of one, and applying the stop loss to the $144.717 price, we got 144.717 – 8.0401 = 136.677. A week later the average S.D. was 8.2319 and the average stock price was 145.4688. Using the same formula with the new S.D. we get 145.4688 – 8.2319 = 137.2369. Now, using the old S.D. on the new average price we get 145.4688-8.0401 = 137.4287. The result of using the week-old S.D. was a stop loss that was 19 cents more than the stop loss derived by using the current S.D. That is 0.14 of 1% difference or 6½ cents on a $50 stock. This is even less variation over one week than with our ATR calculations, probably because it is based on 50 days rather than 14 days.
StopsXL includes The 14-day ATR, the 50-day S.D., 75-day S.D., and the100-day S.D. In addition it will give you the greatest Standard Deviation of the three S.D. measurements if you put the number “5” in the maroon colored cell. Depending on your approach to stop losses, you can choose among four volatility measurements.
We ran another test the following week, comparing Friday data with that for the following Thursday (the market was closed on Good Friday). Again, we were looking to see how far off a stop loss calculation might be if we used the volatility measurement of Friday on the following Thursday rather than using the new Thursday measurements. The difference for the 14-day ATR was 0.63 cents 0.458% on an average stock price of $132.02. This is about 23 cents on stock price of $50. For the 50-day Standard Deviation it was 0.04 cents or 0.035%. This is a little more than 1/10th of 1/3 of 1% or 1½ cents for a $50 stock. For the 75-day Standard Deviation, it differed by 0.308 cents or 0.223% (less than ¼ of 1% or 11.6 cents for a $50 stock). For the 100-day Standard Deviation, it differed by 0.32 cents or 0.233%. This is less than ¼ of 1% or about 12 cents for a $50 stock. These results are not predictive. That is, future results may be very different.
In the first test, the greater volatility measurement of the S.D. is due to the fact that it is covering a longer period of time, and during that extra time there was greater volatility. However, there is more to it than that. There was a strong trend during the time of the test. Standard deviation accounts for directional volatility, while the ATR does not. With the Standard Deviation, a trending stock or market will give a higher value than one that is not trending. The Standard Deviation formula is sensitive to the fact that the increasing prices are further away from the mean. Therefore, if you are working with a stock that is steadily trending, the differences between Standard Deviation and ATR will become more apparent. So, if you’re trading a stock that is trending, Standard Deviation may be a better choice than the ATR.
The S.D. for the same time period that we used for the ATR is 3.597 vs. 4.149 for the ATR (there was not as much deviation from the mean during this period). The fact that the two measurements of volatility are different is not important. Intraday highs and lows are part of ATR computations but not of S.D. computations. The numbers generated for the ATR for non-trending stocks will always be equal to or greater than the numbers generated for the S.D. over the same time period. In such situations, multiplying the ATR by .875 will approximate the S.D. for the same time period. Whatever the reading, the investor can always control the distance to the stop loss with the multiplier. For example, If the S.D. is 8.0401, a multiplier of .5 gives 4.02.
The Standard Deviation is based on closing prices. The ATR includes intraday highs and lows in its calculation. With the Standard Deviation, it is possible to estimate the probability of a stop loss being triggered (cannot be done with the ATR). For example, we know that in a normal distribution there is a15.87% probability that a price will occur that is more than 1 standard deviation (multiplier =1) above or below the average, and only a 2.28% probability that it will reach 2 standard deviations (multiplier =2) above or below the average. Stock price distributions are not precisely “normal” but they are close enough for useful probability estimates. For more on these probabilities, see https://stockdisciplines.com/stop-loss-probabilities/
If volatility increases during the week, what could happen? You could get stopped out of your position because your stop loss would have been based on less volatility. Of course, the new greater volatility would be included in the next update of StopsXL. On the other hand, what is the risk if volatility drops during the week between updates? With lower volatility, you would be less likely to be stopped out of your position. Also, there would be a lower probability of a need to sell. So, the worst result of updating the data for StopsXL weekly rather than daily would be the possibility of being stopped out a little earlier than if the data in StopsXL reflected the increase in volatility over the last few days.
For this version of Stops we have decided to use a 14-day ATR and several Standard Deviation measurements. This range in time periods makes the calculator more useful for short-term traders, swing traders, and intermediate-term investors. The greater time periods covered by our Standard Deviation measurement results in a much larger sampling of price swings. This can be important, because it reduces the odds of whipsaws (selling unnecessarily when a larger sample would have shown that a drop of that magnitude was “normal” for the stock). Again, the user can use the multiplier to adjust sensitivity, causing the trailing stop loss to be closer to or farther away from the current price.
It is important that the user download updated copies of Stops each week. We believe using volatility measurements that are more than a week-old can be risky. While we think the difference in volatility over a single week is most often negligible, and that reasonable adjustments can usually be made, an unusual market plunge or a big surge is always possible. Of course, as mentioned above, if there is a big plunge you will probably be stopped out of your positions, and the next issue of Stops will factor in the increased volatility. And, if there is a big plunge, why would you not want to be stopped out of your position? Isn’t that the purpose of a stop loss?
For illustrations of how different multipliers change the position of stop losses, see https://stockdisciplines.com/stops/
How to Use Stops-XL
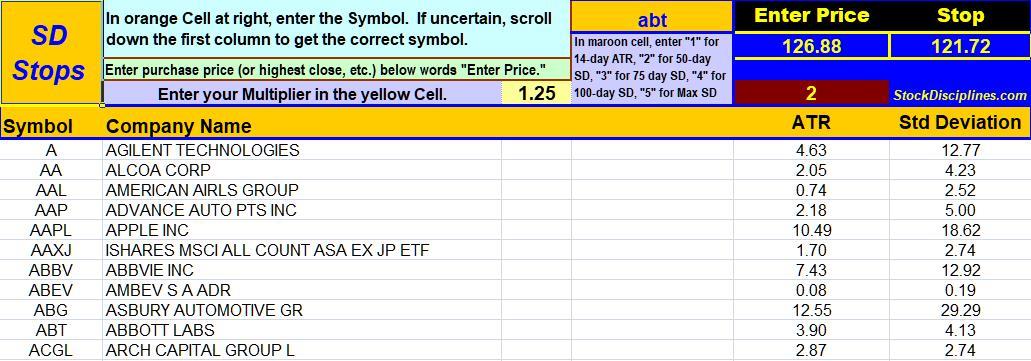
► Enter 1, 2,3,4, or 5 in the maroon cell as per instructions in lavender cell.
► Enter symbol in the orange cell as per instructions in the blue-green cell.
► Enter weighting factor (multiplier) in the yellow cell as per lavender cell.
► Enter reference price (Purchase price, highest close since purchase, etc.
under the words “Enter Price.”
► See calculation result under the word “Stop.”